RBS 2003 Annual Report Download - page 155
Download and view the complete annual report
Please find page 155 of the 2003 RBS annual report below. You can navigate through the pages in the report by either clicking on the pages listed below, or by using the keyword search tool below to find specific information within the annual report.-
 1
1 -
2
-
3
-
4
-
5
-
6
-
7
-
8
-
9
-
10
-
11
-
12
-
13
-
14
-
15
-
16
-
17
-
18
-
19
-
20
-
21
-
22
-
23
-
24
-
25
-
26
-
27
-
28
-
29
-
30
-
31
-
32
-
33
-
34
-
35
-
36
-
37
-
38
-
39
-
40
-
41
-
42
-
43
-
44
-
45
-
46
-
47
-
48
-
49
-
50
-
51
-
52
-
53
-
54
-
55
-
56
-
57
-
58
-
59
-
60
-
61
-
62
-
63
-
64
-
65
-
66
-
67
-
68
-
69
-
70
-
71
-
72
-
73
-
74
-
75
-
76
-
77
-
78
-
79
-
80
-
81
-
82
-
83
-
84
-
85
-
86
-
87
-
88
-
89
-
90
-
91
-
92
-
93
-
94
-
95
-
96
-
97
-
98
-
99
-
100
-
101
-
102
-
103
-
104
-
105
-
106
-
107
-
108
-
109
-
110
-
111
-
112
-
113
-
114
-
115
-
116
-
117
-
118
-
119
-
120
-
121
-
122
-
123
-
124
-
125
-
126
-
127
-
128
-
129
-
130
-
131
-
132
-
133
-
134
-
135
-
136
-
137
-
138
-
139
-
140
-
141
-
142
-
143
-
144
-
 145
145 -
 146
146 -
 147
147 -
 148
148 -
 149
149 -
 150
150 -
 151
151 -
 152
152 -
 153
153 -
 154
154 -
 155
155 -
 156
156 -
 157
157 -
 158
158 -
 159
159 -
 160
160 -
 161
161 -
 162
162 -
 163
163 -
 164
164 -
 165
165 -
166
-
167
-
168
-
169
-
170
-
171
-
172
-
173
-
174
-
175
-
176
-
177
-
178
-
179
-
180
-
181
-
182
-
183
-
184
-
185
-
186
-
187
-
188
-
189
-
190
-
191
-
192
-
193
-
194
-
195
-
196
-
197
-
198
-
199
-
200
-
201
-
202
-
203
-
204
-
205
-
206
-
207
-
208
-
209
-
210
-
211
-
212
-
213
-
214
-
215
-
216
-
217
-
218
-
219
-
220
-
221
-
222
-
223
-
224
-
225
-
226
-
227
-
228
-
229
-
230
 |
 |
153
Annual Report and Accounts 2003
Notes on the accounts
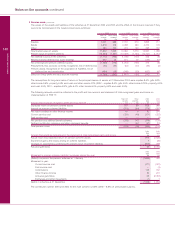
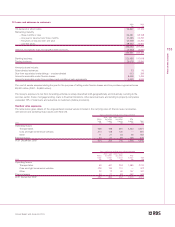
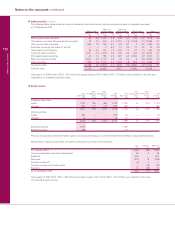
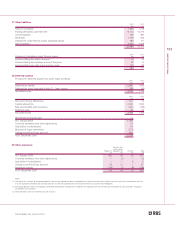
12 Loans and advances to customers
2003 2002
£m £m
On demand or short notice 24,847 21,122
Remaining maturity
– three months or less 64,281 65,108
– one year or less but over three months 27,465 24,750
– five years or less but over one year 40,908 40,364
– over five years 98,952 75,900
256,453 227,244
General and specific bad and doubtful debt provisions (3,922) (3,920)
252,531 223,324
Banking business 223,456 197,818
Trading business 29,075 25,506
Amounts above include:
Subordinated advances 73 96
Due from associated undertakings – unsubordinated 313 289
Amounts receivable under finance leases 8,405 7,496
Amounts receivable under hire purchase and conditional sale agreements 5,935 5,636
The cost of assets acquired during the year for the purpose of letting under finance leases and hire purchase agreements was
£6,361 million (2002 – £4,684 million).
The Group’s exposure to risk from its lending activities is widely diversified both geographically and industrially. Lending to the
services sector, house mortgage lending, loans to financial institutions, other personal loans and lending to property companies
exceeded 10% of total loans and advances to customers (before provisions).
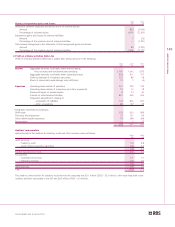
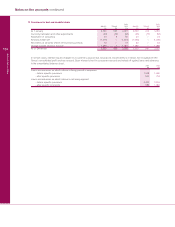
Residual value exposures
The table below gives details of the unguaranteed residual values included in the carrying value of finance lease receivables
(see above) and operating lease assets (see Note 20).
Year in which the residual value will be recovered
After 1 year After 2 years
Within but within but within After
1 year 2 years 5 years 5 years Total
2003 £m £m £m £m £m
Operating leases
Transportation 548 198 481 2,344 3,571
Cars and light commercial vehicles 313 128 120 — 561
Other 11 21 54 96 182
Finance leases 62 21 85 158 326
At 31 December 2003 934 368 740 2,598 4,640
Year in which the residual value will be recovered
After 1 year After 2 years
Within but within but within After
1 year 2 years 5 years 5 years Total
2002 £m £m £m £m £m
Operating leases
Transportation 59 467 204 1,480 2,210
Cars and light commercial vehicles 328 134 110 — 572
Other 22 12 60 147 241
Finance leases 43 71 83 352 549
At 31 December 2002 452 684 457 1,979 3,572