RBS 2003 Annual Report Download - page 80
Download and view the complete annual report
Please find page 80 of the 2003 RBS annual report below. You can navigate through the pages in the report by either clicking on the pages listed below, or by using the keyword search tool below to find specific information within the annual report.-
 1
1 -
2
-
3
-
4
-
5
-
6
-
7
-
8
-
9
-
10
-
11
-
12
-
13
-
14
-
15
-
16
-
17
-
18
-
19
-
20
-
21
-
22
-
23
-
24
-
25
-
26
-
27
-
28
-
29
-
30
-
31
-
32
-
33
-
34
-
35
-
36
-
37
-
38
-
39
-
40
-
41
-
42
-
43
-
44
-
45
-
46
-
47
-
48
-
49
-
50
-
51
-
52
-
53
-
54
-
55
-
56
-
57
-
58
-
59
-
60
-
61
-
62
-
63
-
64
-
65
-
66
-
67
-
68
-
69
-
 70
70 -
 71
71 -
 72
72 -
 73
73 -
 74
74 -
 75
75 -
 76
76 -
 77
77 -
 78
78 -
 79
79 -
 80
80 -
 81
81 -
 82
82 -
 83
83 -
 84
84 -
 85
85 -
 86
86 -
 87
87 -
 88
88 -
 89
89 -
 90
90 -
91
-
92
-
93
-
94
-
95
-
96
-
97
-
98
-
99
-
100
-
101
-
102
-
103
-
104
-
105
-
106
-
107
-
108
-
109
-
110
-
111
-
112
-
113
-
114
-
115
-
116
-
117
-
118
-
119
-
120
-
121
-
122
-
123
-
124
-
125
-
126
-
127
-
128
-
129
-
130
-
131
-
132
-
133
-
134
-
135
-
136
-
137
-
138
-
139
-
140
-
141
-
142
-
143
-
144
-
145
-
146
-
147
-
148
-
149
-
150
-
151
-
152
-
153
-
154
-
155
-
156
-
157
-
158
-
159
-
160
-
161
-
162
-
163
-
164
-
165
-
166
-
167
-
168
-
169
-
170
-
171
-
172
-
173
-
174
-
175
-
176
-
177
-
178
-
179
-
180
-
181
-
182
-
183
-
184
-
185
-
186
-
187
-
188
-
189
-
190
-
191
-
192
-
193
-
194
-
195
-
196
-
197
-
198
-
199
-
200
-
201
-
202
-
203
-
204
-
205
-
206
-
207
-
208
-
209
-
210
-
211
-
212
-
213
-
214
-
215
-
216
-
217
-
218
-
219
-
220
-
221
-
222
-
223
-
224
-
225
-
226
-
227
-
228
-
229
-
230
 |
 |

Operating and financial review continued
78
Operating and financial review
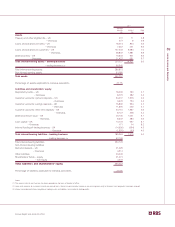
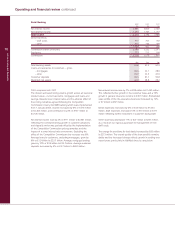
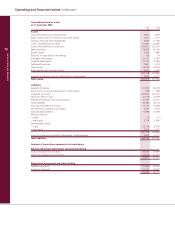
Retail Banking
2003 2002 2001
£m £m £m
Net interest income 2,951 2,840 2,622
Non-interest income 1,452 1,353 1,277
Total income 4,403 4,193 3,899
Direct expenses
– staff costs 777 707 702
– other 227 254 226
1,004 961 928
Contribution before provisions 3,399 3,232 2,971
Provisions 273 213 164
Contribution 3,126 3,019 2,807
£bn £bn £bn
Total banking assets 63.8 57.4 50.9
Loans and advances to customers – gross
– mortgages 36.6 32.1 28.5
– other 25.2 23.5 20.5
Customer deposits 66.3 61.7 56.8
Weighted risk assets 42.9 38.8 35.2
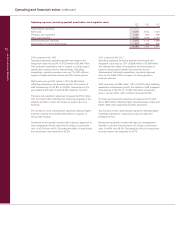
2003 compared with 2002
The division achieved strong volume growth across all personal
product areas - current accounts, mortgages and loans and
savings. Despite lower interest rates and the adverse effect of
the pricing remedies agreed following the Competition
Commission inquiry into SME banking which were implemented
from 1 January 2003, income increased by 5% or £210 million
to £4,403 million, and contribution by 4% or £107 million to
£3,126 million.
Net interest income rose by 4% or £111 million to £2,951 million,
reflecting the continued strong growth in customer advances
and deposits which was partially offset by the implementation
of the Competition Commission pricing remedies and the
impact of a lower interest rate environment. Excluding the
effect of the Competition Commission the increase was 8%.
Average loans to customers, excluding mortgages, grew by
9% or £1.9 billion to £23.7 billion. Average mortgage lending
grew by 12% or £3.6 billion to £33.7 billion. Average customer
deposits increased by 6% or £3.7 billion to £60.9 billion.
Non-interest income rose by 7% or £99 million to £1,452 million.
This reflected further growth in the customer base and a 15%
growth in general insurance income to £301 million. Embedded
value profits of the life assurance business increased by 14%,
or £7 million to £57 million.
Direct expenses increased by 4% or £43 million to £1,004
million. Staff expenses increased 10% or £70 million to £777
million reflecting further investment in customer facing staff.
Other expenses decreased 11% or £27 million to £227 million,
as a result of our rigorous approach to management of non-
staff costs.
The charge for provisions for bad debts increased by £60 million
to £273 million. The overall quality of the loan portfolio remains
stable and the increased charge reflects growth in lending over
recent years particularly in NatWest since its acquisition.