RBS 2003 Annual Report Download - page 194
Download and view the complete annual report
Please find page 194 of the 2003 RBS annual report below. You can navigate through the pages in the report by either clicking on the pages listed below, or by using the keyword search tool below to find specific information within the annual report.-
 1
1 -
2
-
3
-
4
-
5
-
6
-
7
-
8
-
9
-
10
-
11
-
12
-
13
-
14
-
15
-
16
-
17
-
18
-
19
-
20
-
21
-
22
-
23
-
24
-
25
-
26
-
27
-
28
-
29
-
30
-
31
-
32
-
33
-
34
-
35
-
36
-
37
-
38
-
39
-
40
-
41
-
42
-
43
-
44
-
45
-
46
-
47
-
48
-
49
-
50
-
51
-
52
-
53
-
54
-
55
-
56
-
57
-
58
-
59
-
60
-
61
-
62
-
63
-
64
-
65
-
66
-
67
-
68
-
69
-
70
-
71
-
72
-
73
-
74
-
75
-
76
-
77
-
78
-
79
-
80
-
81
-
82
-
83
-
84
-
85
-
86
-
87
-
88
-
89
-
90
-
91
-
92
-
93
-
94
-
95
-
96
-
97
-
98
-
99
-
100
-
101
-
102
-
103
-
104
-
105
-
106
-
107
-
108
-
109
-
110
-
111
-
112
-
113
-
114
-
115
-
116
-
117
-
118
-
119
-
120
-
121
-
122
-
123
-
124
-
125
-
126
-
127
-
128
-
129
-
130
-
131
-
132
-
133
-
134
-
135
-
136
-
137
-
138
-
139
-
140
-
141
-
142
-
143
-
144
-
145
-
146
-
147
-
148
-
149
-
150
-
151
-
152
-
153
-
154
-
155
-
156
-
157
-
158
-
159
-
160
-
161
-
162
-
163
-
164
-
165
-
166
-
167
-
168
-
169
-
170
-
171
-
172
-
173
-
174
-
175
-
176
-
177
-
178
-
179
-
180
-
181
-
182
-
183
-
 184
184 -
 185
185 -
 186
186 -
 187
187 -
 188
188 -
 189
189 -
 190
190 -
 191
191 -
 192
192 -
 193
193 -
 194
194 -
 195
195 -
 196
196 -
 197
197 -
 198
198 -
 199
199 -
 200
200 -
 201
201 -
 202
202 -
 203
203 -
 204
204 -
205
-
206
-
207
-
208
-
209
-
210
-
211
-
212
-
213
-
214
-
215
-
216
-
217
-
218
-
219
-
220
-
221
-
222
-
223
-
224
-
225
-
226
-
227
-
228
-
229
-
230
 |
 |

192
Notes on the accounts continued
Notes on the accounts
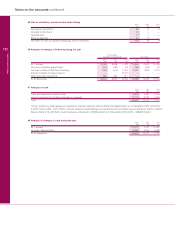
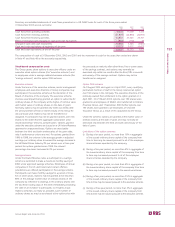
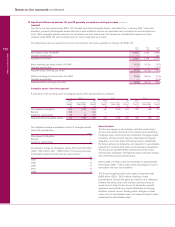
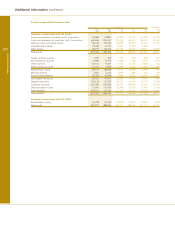
Loan impairment
At 31 December 2003 and 2002, the Group estimated that the
difference between the carrying value of its loan portfolio under
US GAAP and its value in the Group’s UK GAAP financial
statements was such that no adjustment to net income or
consolidated shareholders’ equity was required. At 31 December
2003, the Group’s non-accrual loans, loans past due 90 days
and troubled debt restructurings amounted to £5,157 million
(2002 – £4,871 million). Specific provisions of £2,782 million
(2002 – £2,435 million) were held against these loans. Average
non-accrual loans, loans past due 90 days and troubled debt
restructurings for the year to 31 December 2003 were £5,166
million (2002 – £4,762 million).
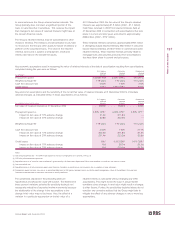
Gross interest income not recognised, but which would have
been recognised under the original terms of non-accrual and
restructured loans, amounted to £237 million for the year
ended 31 December 2003 (2002 – £234 million; 2001 – £173
million) from domestic loans and £55 million for the year ended
31 December 2003 (2002 – £73 million; 2001 – £60 million) from
foreign loans. Interest on non-accrual and restructured loans
included in net income was £60 million for the year ended 31
December 2003 (2002 – £47 million; 2001 – £42 million) from
domestic loans and £3 million for the year ended 31 December
2003 (2001 – £7 million; 2000 – £14 million) from foreign loans.
Securities
During 2003, there were no gross gains or gross losses included
in US GAAP net income from transfers of securities from the
available-for-sale category into the trading category. For 2003,
net unrealised losses of £652 million on available-for-sale
securities were included in US GAAP other comprehensive
income and £164 million was reclassified from accumulated
other comprehensive income into US GAAP net income.
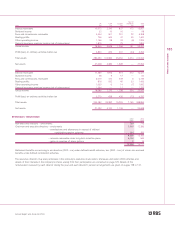
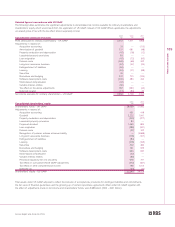
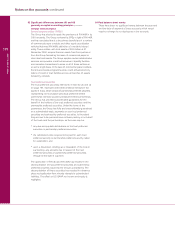
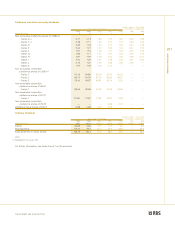
53 Significant differences between UK and US
generally accepted accounting principles (continued)
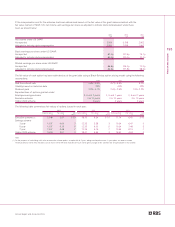
Cash flow statements
There are many similarities between SFAS 95, ‘Statement of Cash Flows’ as amended by SFAS 104 ‘Statement of Cash Flows – Net
Reporting of Certain Cash Receipts and Cash Payments and Classification of Cash Flows from Hedging Transactions’, and FRS 1
‘Cash Flow Statements’ (Revised). The principal differences are the classifications of certain transactions.
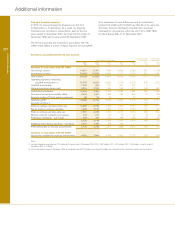
Classification under FRS 1 Classification under SFAS 95
Equity dividends paid Equity dividends paid Financing activities
Dividends paid on non-equity shares Returns on investments and Financing activities
servicing of finance
Tax paid Taxation Operating activities
Purchase and sale of associated and Acquisitions and disposals Investing activities
subsidiary undertakings
Purchase and sale of investment securities Capital expenditure and Investing activities
and fixed assets financial investment
Net change in loans and advances, Operating activities Investing activities
including finance lease receivables
Net change in deposits Operating activities Financing activities
Net change in debt securities in issue Operating activities Financing activities
Short-term funding not Operating activities Financing activities
included in cash