RBS 2003 Annual Report Download - page 108
Download and view the complete annual report
Please find page 108 of the 2003 RBS annual report below. You can navigate through the pages in the report by either clicking on the pages listed below, or by using the keyword search tool below to find specific information within the annual report.-
 1
1 -
2
-
3
-
4
-
5
-
6
-
7
-
8
-
9
-
10
-
11
-
12
-
13
-
14
-
15
-
16
-
17
-
18
-
19
-
20
-
21
-
22
-
23
-
24
-
25
-
26
-
27
-
28
-
29
-
30
-
31
-
32
-
33
-
34
-
35
-
36
-
37
-
38
-
39
-
40
-
41
-
42
-
43
-
44
-
45
-
46
-
47
-
48
-
49
-
50
-
51
-
52
-
53
-
54
-
55
-
56
-
57
-
58
-
59
-
60
-
61
-
62
-
63
-
64
-
65
-
66
-
67
-
68
-
69
-
70
-
71
-
72
-
73
-
74
-
75
-
76
-
77
-
78
-
79
-
80
-
81
-
82
-
83
-
84
-
85
-
86
-
87
-
88
-
89
-
90
-
91
-
92
-
93
-
94
-
95
-
96
-
97
-
 98
98 -
 99
99 -
 100
100 -
 101
101 -
 102
102 -
 103
103 -
 104
104 -
 105
105 -
 106
106 -
 107
107 -
 108
108 -
 109
109 -
 110
110 -
 111
111 -
 112
112 -
 113
113 -
 114
114 -
 115
115 -
 116
116 -
 117
117 -
 118
118 -
119
-
120
-
121
-
122
-
123
-
124
-
125
-
126
-
127
-
128
-
129
-
130
-
131
-
132
-
133
-
134
-
135
-
136
-
137
-
138
-
139
-
140
-
141
-
142
-
143
-
144
-
145
-
146
-
147
-
148
-
149
-
150
-
151
-
152
-
153
-
154
-
155
-
156
-
157
-
158
-
159
-
160
-
161
-
162
-
163
-
164
-
165
-
166
-
167
-
168
-
169
-
170
-
171
-
172
-
173
-
174
-
175
-
176
-
177
-
178
-
179
-
180
-
181
-
182
-
183
-
184
-
185
-
186
-
187
-
188
-
189
-
190
-
191
-
192
-
193
-
194
-
195
-
196
-
197
-
198
-
199
-
200
-
201
-
202
-
203
-
204
-
205
-
206
-
207
-
208
-
209
-
210
-
211
-
212
-
213
-
214
-
215
-
216
-
217
-
218
-
219
-
220
-
221
-
222
-
223
-
224
-
225
-
226
-
227
-
228
-
229
-
230
 |
 |

Operating and financial review continued
106
Operating and financial review
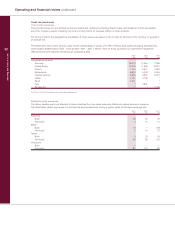
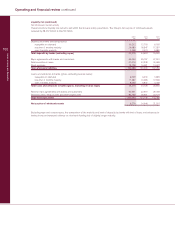
Market risk (continued)
Non-trading
The principal market risks arising from the Group's non-trading
activities are interest rate risk, currency risk and equity risk.
Treasury activity and mismatches between the repricing of
assets and liabilities in its retail and corporate banking
operations account for most of the non-trading interest rate
risk. Non-trading currency risk derives from the Group's
investments in overseas subsidiaries, associates and branches.
The Group's venture capital portfolio, investments held by its
general insurance business and its strategic equity investments
are the principal sources of non-trading equity price risk. The
Group's portfolios of non-trading financial instruments mainly
comprise loans (including finance leases), debt securities,
equity shares, deposits, certificates of deposits and other debt
securities issued, loan capital and derivatives. To reflect their
distinct nature, the Group's long-term assurance assets and
liabilities attributable to policyholders have been excluded from
these market risk disclosures.
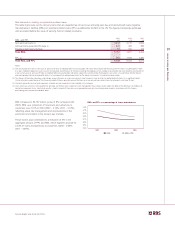
Interest rate risk
Treasury
The Group’s treasury activities include its money market
business and the management of internal funds flow within the
Group’s businesses. Money market portfolios include cash
instruments (principally debt securities, loans and deposits)
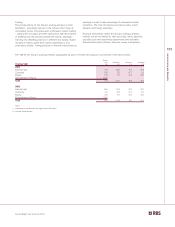
and related hedging derivatives. VaR for the Group’s treasury
portfolios, which relates mainly to interest rate risk was £8.1
million at 31 December 2003 (2002 – £6.5 million). During the
year the maximum VaR was £11.0 million (2002 – £6.7 million),
the minimum £5.6 million (2002 – £3.5 million) and the average
£8.3 million (2002 – £4.4 million).
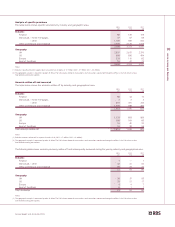
Retail and corporate banking
Structural interest rate risk arises in these activities where
assets and liabilities have different repricing dates. It is the
Group’s policy to minimise the sensitivity of net interest income
to changes in interest rates and where interest rate risk is
retained to ensure that appropriate resources, measures and
limits are applied.
Structural interest rate risk is calculated in each division on the
basis of establishing the repricing behaviour of each asset
and liability product. For many products, the actual interest rate
repricing characteristics differ from the contractual repricing.
In most cases, the repricing maturity is determined by the
market interest rate that most closely fits the historical
behaviour of the product interest rate. For non-interest bearing
current accounts, the repricing maturity is determined by the
stability of the portfolio. The repricing maturities used are
approved by Group Treasury and divisional asset and liability
committees at least annually. Key conventions are reviewed
annually by GALCO.
A static maturity gap report is produced as at the month-end
for each division, in each functional currency based on the
behaviouralised repricing for each product. It is Group policy
to include in the gap report, non-financial assets and liabilities,
mainly tangible fixed assets and the Group’s capital and
reserves, spread over medium and longer term maturities. This
report also includes hedge transactions, principally derivatives.
Any residual non-trading interest rate exposures are controlled
by limiting repricing mismatches in the individual balance
sheets. Potential exposures to interest rate movements in the
medium to long term are measured and controlled using a
version of the same VaR methodology that is used for the
Group’s trading portfolios but without discount factors. Net
interest income exposures are measured and controlled in
terms of sensitivity over time to movements in interest rates.
Non-trading interest rate VaR
Non-trading interest rate VaR for the Group’s treasury and
retail and corporate banking activities was £78.1 million at
31 December 2003 (2002 – £34.7 million) with the major
exposure being to changes in longer term US dollar interest
rates. During the year, the maximum VaR was £78.1 million
(2002 – £34.7 million), the minimum £29.9 million (2002 – £9.7
million) and the average £51.7 million (2002 – £14.5 million).