RBS 2003 Annual Report Download - page 73
Download and view the complete annual report
Please find page 73 of the 2003 RBS annual report below. You can navigate through the pages in the report by either clicking on the pages listed below, or by using the keyword search tool below to find specific information within the annual report.-
 1
1 -
2
-
3
-
4
-
5
-
6
-
7
-
8
-
9
-
10
-
11
-
12
-
13
-
14
-
15
-
16
-
17
-
18
-
19
-
20
-
21
-
22
-
23
-
24
-
25
-
26
-
27
-
28
-
29
-
30
-
31
-
32
-
33
-
34
-
35
-
36
-
37
-
38
-
39
-
40
-
41
-
42
-
43
-
44
-
45
-
46
-
47
-
48
-
49
-
50
-
51
-
52
-
53
-
54
-
55
-
56
-
57
-
58
-
59
-
60
-
61
-
62
-
 63
63 -
 64
64 -
 65
65 -
 66
66 -
 67
67 -
 68
68 -
 69
69 -
 70
70 -
 71
71 -
 72
72 -
 73
73 -
 74
74 -
 75
75 -
 76
76 -
 77
77 -
 78
78 -
 79
79 -
 80
80 -
 81
81 -
 82
82 -
 83
83 -
84
-
85
-
86
-
87
-
88
-
89
-
90
-
91
-
92
-
93
-
94
-
95
-
96
-
97
-
98
-
99
-
100
-
101
-
102
-
103
-
104
-
105
-
106
-
107
-
108
-
109
-
110
-
111
-
112
-
113
-
114
-
115
-
116
-
117
-
118
-
119
-
120
-
121
-
122
-
123
-
124
-
125
-
126
-
127
-
128
-
129
-
130
-
131
-
132
-
133
-
134
-
135
-
136
-
137
-
138
-
139
-
140
-
141
-
142
-
143
-
144
-
145
-
146
-
147
-
148
-
149
-
150
-
151
-
152
-
153
-
154
-
155
-
156
-
157
-
158
-
159
-
160
-
161
-
162
-
163
-
164
-
165
-
166
-
167
-
168
-
169
-
170
-
171
-
172
-
173
-
174
-
175
-
176
-
177
-
178
-
179
-
180
-
181
-
182
-
183
-
184
-
185
-
186
-
187
-
188
-
189
-
190
-
191
-
192
-
193
-
194
-
195
-
196
-
197
-
198
-
199
-
200
-
201
-
202
-
203
-
204
-
205
-
206
-
207
-
208
-
209
-
210
-
211
-
212
-
213
-
214
-
215
-
216
-
217
-
218
-
219
-
220
-
221
-
222
-
223
-
224
-
225
-
226
-
227
-
228
-
229
-
230
 |
 |
71
Operating and financial review
Annual Report and Accounts 2003
2003 compared with 2002
Non-interest income increased by 22%, or £1,962 million, to
£10,928 million. Non-interest income now represents 57% of
total income. Excluding general insurance premium income,
non-interest income rose by 11% or £795 million to £7,867
million reflecting strong performances in CBFM, up 18% or
£670 million and Retail Direct, up 17%, or £145 million.
Within non-interest income, fees and commissions receivable
increased by 8% or £447 million, to £5,755 million. This
reflected an increase in lending and transmission fees, and
good growth in insurance brokerage, cards related fees and
ATM income.
Fees and commissions payable increased by £372 million to
£1,337 million reflecting higher brokerage costs in CBFM, fees
paid in Retail Direct in support of higher volumes and
commissions payable to brokers and intermediaries following
the acquisition of Churchill.
Dealing profits at £1,793 million were up £331 million, 23% on
2002. This reflects strong growth in volumes in all product
areas. The performance in the first half of the year benefited
from the unusually high levels of demand for mortgage backed
securities in the US.
Other operating income increased by 32% to £1,598 million.
This was due to growth in income from rental assets
(comprising operating lease assets and investment properties)
and higher investment securities gains.
General insurance premium income, after reinsurance, rose by
62%, or £1,167 million to £3,061 million. Excluding the acquisition
of Churchill Insurance the growth was 26% or £487 million
reflecting volume growth in motor and home insurance products.
2002 compared with 2001
Non-interest income increased by 16%, or £1,254 million, to
£8,966 million. Non-interest income accounted for 53% of total
income. Excluding general insurance premium income, non-
interest income rose by 12% or £735 million to £7,072 million
reflecting strong performances in CBFM, up 12% or £384
million, Retail Direct, up 21%, or £145 million and Citizens,
up £162 million of which £121 million related to acquisitions.
Within non-interest income, net fees and commissions
increased by £538 million, 14% to £4,343 million. This reflected
higher transmission fees in Retail Banking due to the growth in
packaged accounts and in Citizens which benefited from
acquisitions, increase in lending fees, particularly in CBFM and
higher insurance income. Strong growth in Cards business and
TPF also contributed to this increase.
Dealing profits at £1,462 million were up £36 million, 3% on the
strong performance in 2001. The increase in dealing profits
resulted from customer led business growth and higher
revenues from trading in interest rate instruments.
Other operating income increased by 15% to £1,209 million.
This was due to the significant growth in CBFM’s operating
lease business, where income rose by 16%, £112 million, and
higher profits from sale of investment securities.
General insurance premium income, after reinsurance, rose by
38%, or £519 million reflecting RBS Insurance’s organic growth
and acquisitions in Continental Europe.
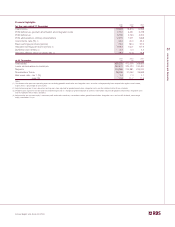
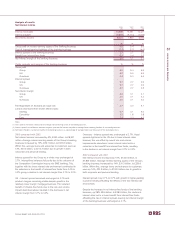
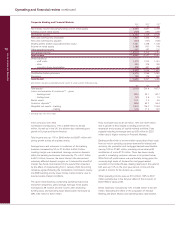
Non-interest income
2003 2002 2001
£m £m £m
Dividend income 58 58 54
Fees and commissions receivable 5,755 5,308 4,735
Fees and commissions payable (1,337) (965) (930)
Dealing profits 1,793 1,462 1,426
Other operating income 1,598 1,209 1,052
7,867 7,072 6,337
General insurance premium income
Earned premiums 3,565 2,383 1,804
Reinsurance (504) (489) (429)
3,061 1,894 1,375
10,928 8,966 7,712