RBS 2003 Annual Report Download - page 176
Download and view the complete annual report
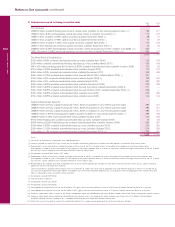
Please find page 176 of the 2003 RBS annual report below. You can navigate through the pages in the report by either clicking on the pages listed below, or by using the keyword search tool below to find specific information within the annual report.-
 1
1 -
2
-
3
-
4
-
5
-
6
-
7
-
8
-
9
-
10
-
11
-
12
-
13
-
14
-
15
-
16
-
17
-
18
-
19
-
20
-
21
-
22
-
23
-
24
-
25
-
26
-
27
-
28
-
29
-
30
-
31
-
32
-
33
-
34
-
35
-
36
-
37
-
38
-
39
-
40
-
41
-
42
-
43
-
44
-
45
-
46
-
47
-
48
-
49
-
50
-
51
-
52
-
53
-
54
-
55
-
56
-
57
-
58
-
59
-
60
-
61
-
62
-
63
-
64
-
65
-
66
-
67
-
68
-
69
-
70
-
71
-
72
-
73
-
74
-
75
-
76
-
77
-
78
-
79
-
80
-
81
-
82
-
83
-
84
-
85
-
86
-
87
-
88
-
89
-
90
-
91
-
92
-
93
-
94
-
95
-
96
-
97
-
98
-
99
-
100
-
101
-
102
-
103
-
104
-
105
-
106
-
107
-
108
-
109
-
110
-
111
-
112
-
113
-
114
-
115
-
116
-
117
-
118
-
119
-
120
-
121
-
122
-
123
-
124
-
125
-
126
-
127
-
128
-
129
-
130
-
131
-
132
-
133
-
134
-
135
-
136
-
137
-
138
-
139
-
140
-
141
-
142
-
143
-
144
-
145
-
146
-
147
-
148
-
149
-
150
-
151
-
152
-
153
-
154
-
155
-
156
-
157
-
158
-
159
-
160
-
161
-
162
-
163
-
164
-
165
-
 166
166 -
 167
167 -
 168
168 -
 169
169 -
 170
170 -
 171
171 -
 172
172 -
 173
173 -
 174
174 -
 175
175 -
 176
176 -
 177
177 -
 178
178 -
 179
179 -
 180
180 -
 181
181 -
 182
182 -
 183
183 -
 184
184 -
 185
185 -
 186
186 -
187
-
188
-
189
-
190
-
191
-
192
-
193
-
194
-
195
-
196
-
197
-
198
-
199
-
200
-
201
-
202
-
203
-
204
-
205
-
206
-
207
-
208
-
209
-
210
-
211
-
212
-
213
-
214
-
215
-
216
-
217
-
218
-
219
-
220
-
221
-
222
-
223
-
224
-
225
-
226
-
227
-
228
-
229
-
230
 |
 |
174
Notes on the accounts continued
Notes on the accounts
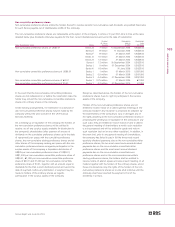
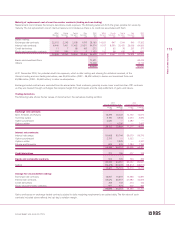
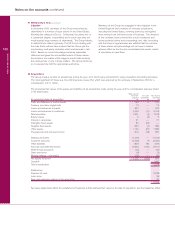
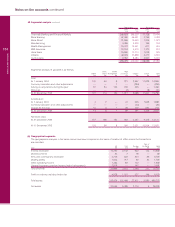
39 Derivatives (continued)
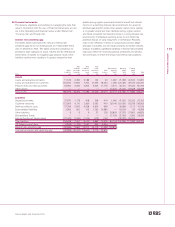
The following table analyses, by maturity and contract type, the notional principal amounts of the Group’s trading derivatives:
Within One to Two to Over 2003 Within One to Two to Over 2002
one year two years five years five years Total one year two years five years five years Total
£bn £bn £bn £bn £bn £bn £bn £bn £bn £bn
Exchange rate contracts:
Spot, forwards and futures 616.8 24.9 7.2 0.2 649.1 504.5 26.8 4.5 0.2 536.0
Currency swaps 43.5 26.0 43.4 33.3 146.2 46.8 19.8 34.2 22.7 123.5
Options purchased 156.1 10.5 4.1 1.0 171.7 114.9 3.5 1.2 — 119.6
Options written 164.7 8.5 3.4 1.1 177.7 114.0 4.6 1.1 0.2 119.9
981.1 69.9 58.1 35.6 1,144.7 780.2 54.7 41.0 23.1 899.0
Interest rate contracts:
Interest rate swaps 1,555.8 675.6 960.8 630.1 3,822.3 1,115.5 537.3 662.3 485.2 2,800.3
Options purchased 91.1 34.2 49.3 50.4 225.0 69.5 21.6 46.9 38.9 176.9
Options written 48.0 36.6 47.0 48.5 180.1 51.9 26.8 43.4 38.8 160.9
Futures and forwards 865.3 159.3 55.3 0.5 1,080.4 606.4 116.0 39.4 0.5 762.3
2,560.2 905.7 1,112.4 729.5 5,307.8 1,843.3 701.7 792.0 563.4 3,900.4
Credit derivatives 7.1 1.7 11.9 7.8 28.5 3.2 6.0 4.7 8.1 22.0
Equity and commodity contracts 20.4 5.3 8.2 0.2 34.1 12.9 6.7 3.7 0.2 23.5
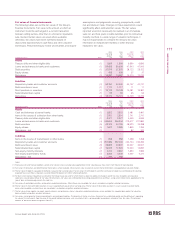
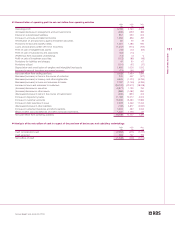
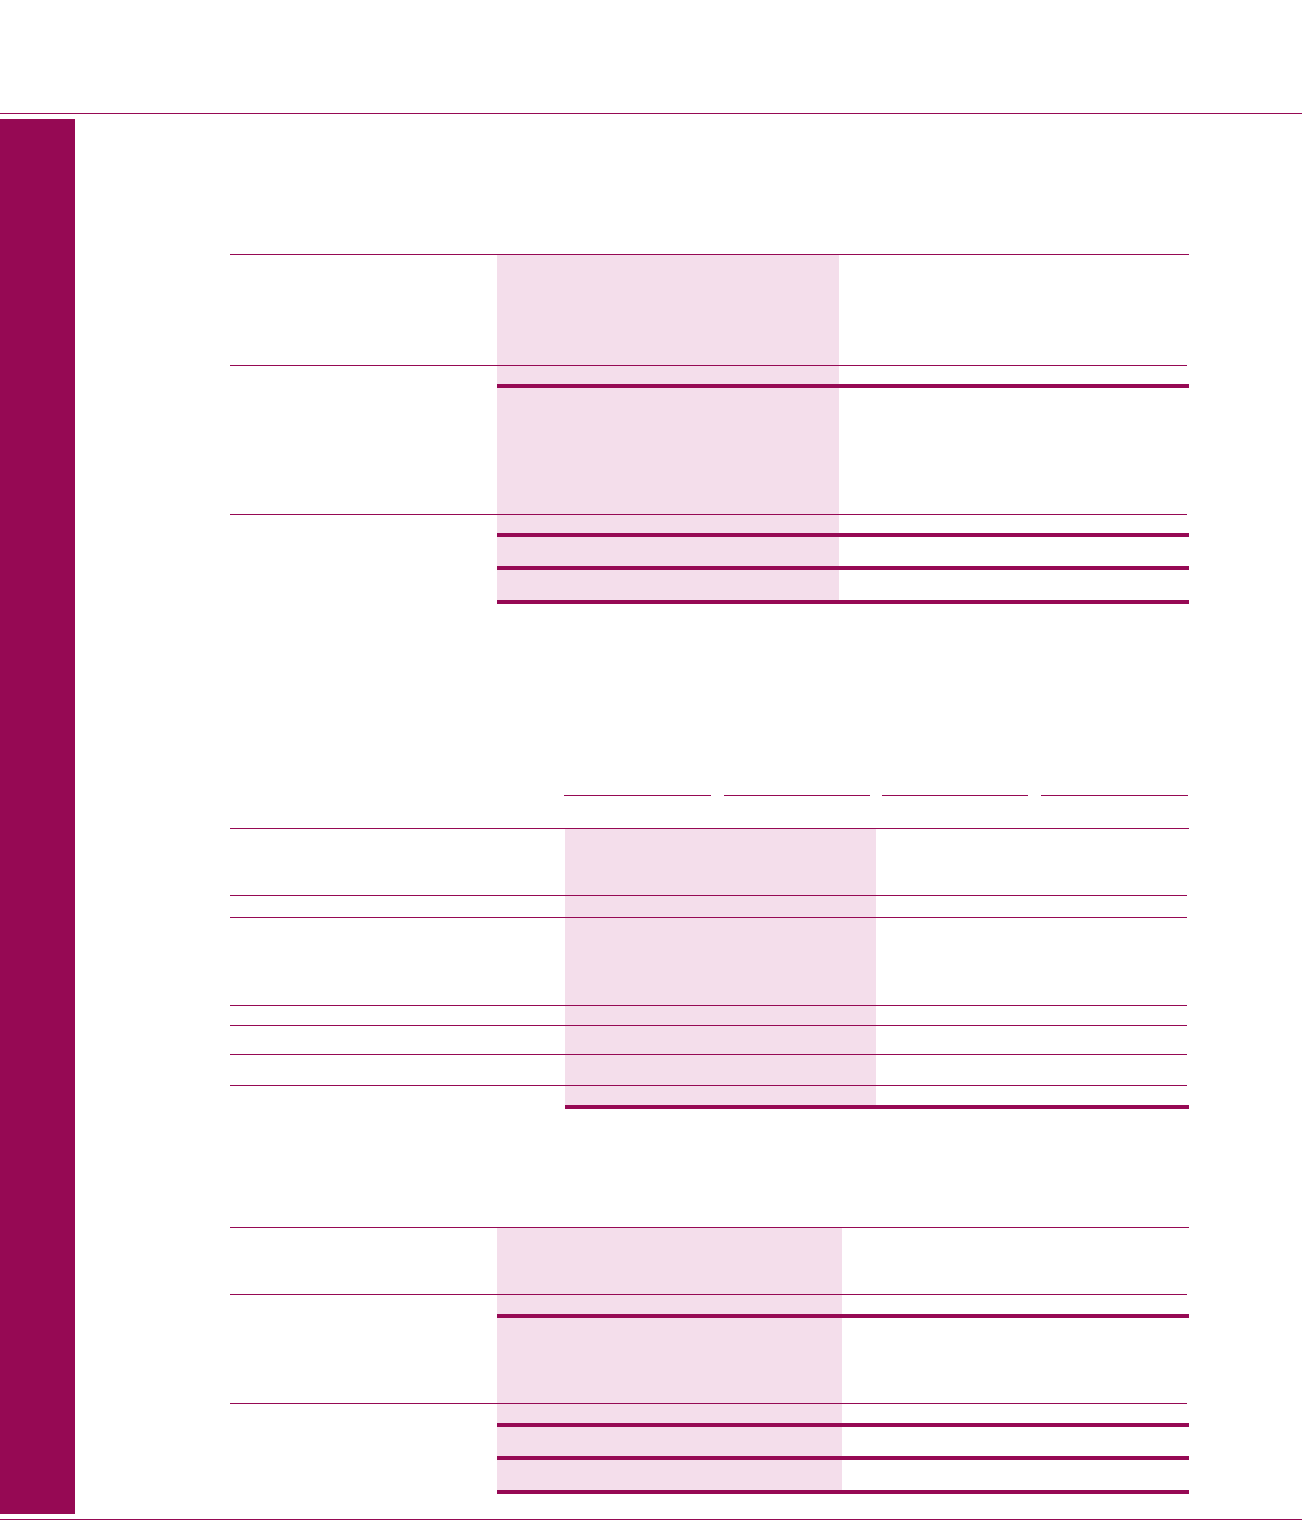
Non-trading derivatives
The Group establishes non-trading derivatives positions externally with third parties and also internally. It should be noted that the
following tables include the components of the internal hedging programme that transfers risks to the trading portfolios in the Group
or to external third party participants in the derivatives markets.
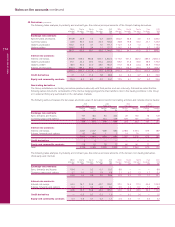
The following table summarises the fair values and book values of derivatives held for non-trading activities and includes internal trades:
2003 2003 2002 2002
Fair value Book value Fair value Book value
Positive Negative Positive Negative Positive Negative Positive Negative
£m £m £m £m £m £m £m £m
Exchange rate contracts:
Spot, forwards and futures 101 464 94 460 25 135 16 125
Currency swaps and options 304 210 224 135 199 107 111 76
405 674 318 595 224 242 127 201
Interest rate contracts:
Interest rate swaps 2,541 2,247 608 683 2,983 2,504 675 587
Futures, forwards and options 62 416 1 2 14 74 — —
2,603 2,663 609 685 2,997 2,578 675 587
Credit derivatives 36———4——
Equity and commodity contracts 118 52 78 22 86 141 77 9
Total 3,129 3,395 1,005 1,302 3,307 2,965 879 797
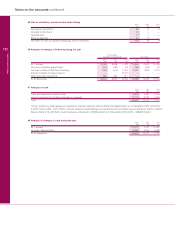
The following table analyses, by maturity and contract type, the notional principal amounts of the Group’s non-trading derivatives
(third party and internal):
Within One to Two to Over 2003 Within One to Two to Over 2002
one year two years five years five years Total one year two years five years five years Total
£bn £bn £bn £bn £bn £bn £bn £bn £bn £bn
Exchange rate contracts:
Spot, forwards and futures 19.4 — 0.2 0.1 19.7 8.8———8.8
Currency swaps and options 3.2 1.0 0.7 1.9 6.8 2.1 0.2 1.3 1.7 5.3
22.6 1.0 0.9 2.0 26.5 10.9 0.2 1.3 1.7 14.1
Interest rate contracts:
Interest rate swaps 34.4 15.1 33.5 43.7 126.7 32.0 16.6 27.3 33.4 109.3
Futures, forwards and options 0.4 0.1 3.3 4.6 8.4 0.9 0.2 0.7 1.1 2.9
34.8 15.2 36.8 48.3 135.1 32.9 16.8 28.0 34.5 112.2
Credit derivatives — 0.5 0.2 0.3 1.0 — 0.1 1.4 — 1.5
Equity and commodity contracts 0.3 0.5 0.7 0.2 1.7 0.6 0.2 1.1 0.3 2.2