RBS 2003 Annual Report Download - page 177
Download and view the complete annual report
Please find page 177 of the 2003 RBS annual report below. You can navigate through the pages in the report by either clicking on the pages listed below, or by using the keyword search tool below to find specific information within the annual report.-
 1
1 -
2
-
3
-
4
-
5
-
6
-
7
-
8
-
9
-
10
-
11
-
12
-
13
-
14
-
15
-
16
-
17
-
18
-
19
-
20
-
21
-
22
-
23
-
24
-
25
-
26
-
27
-
28
-
29
-
30
-
31
-
32
-
33
-
34
-
35
-
36
-
37
-
38
-
39
-
40
-
41
-
42
-
43
-
44
-
45
-
46
-
47
-
48
-
49
-
50
-
51
-
52
-
53
-
54
-
55
-
56
-
57
-
58
-
59
-
60
-
61
-
62
-
63
-
64
-
65
-
66
-
67
-
68
-
69
-
70
-
71
-
72
-
73
-
74
-
75
-
76
-
77
-
78
-
79
-
80
-
81
-
82
-
83
-
84
-
85
-
86
-
87
-
88
-
89
-
90
-
91
-
92
-
93
-
94
-
95
-
96
-
97
-
98
-
99
-
100
-
101
-
102
-
103
-
104
-
105
-
106
-
107
-
108
-
109
-
110
-
111
-
112
-
113
-
114
-
115
-
116
-
117
-
118
-
119
-
120
-
121
-
122
-
123
-
124
-
125
-
126
-
127
-
128
-
129
-
130
-
131
-
132
-
133
-
134
-
135
-
136
-
137
-
138
-
139
-
140
-
141
-
142
-
143
-
144
-
145
-
146
-
147
-
148
-
149
-
150
-
151
-
152
-
153
-
154
-
155
-
156
-
157
-
158
-
159
-
160
-
161
-
162
-
163
-
164
-
165
-
166
-
 167
167 -
 168
168 -
 169
169 -
 170
170 -
 171
171 -
 172
172 -
 173
173 -
 174
174 -
 175
175 -
 176
176 -
 177
177 -
 178
178 -
 179
179 -
 180
180 -
 181
181 -
 182
182 -
 183
183 -
 184
184 -
 185
185 -
 186
186 -
 187
187 -
188
-
189
-
190
-
191
-
192
-
193
-
194
-
195
-
196
-
197
-
198
-
199
-
200
-
201
-
202
-
203
-
204
-
205
-
206
-
207
-
208
-
209
-
210
-
211
-
212
-
213
-
214
-
215
-
216
-
217
-
218
-
219
-
220
-
221
-
222
-
223
-
224
-
225
-
226
-
227
-
228
-
229
-
230
 |
 |

175
Annual Report and Accounts 2003
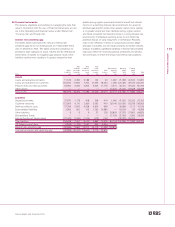
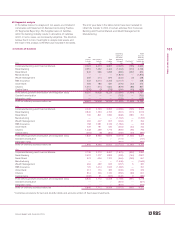
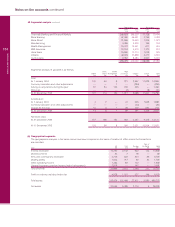
Notes on the accounts
After After After
3 months 6 months 1 year Non-interest Banking Trading
Within but within but within but within After bearing book book
3 months 6 months 1 year 5 years 5 years funds total total Total
2003 £m £m £m £m £m £m £m £m £m
Assets
Loans and advances to banks 11,149 3,780 5,188 122 32 1,087 21,358 30,533 51,891
Loans and advances to customers 155,920 11,832 7,763 27,992 18,463 1,486 223,456 29,075 252,531
Treasury bills and debt securities 18,906 2,594 4,835 5,525 11,175 2,316 45,351 39,444 84,795
Other assets —————47,430 47,430 18,628 66,058
Total assets 185,975 18,206 17,786 33,639 29,670 52,319 337,595 117,680 455,275
Liabilities
Deposits by banks 37,670 1,178 408 308 414 1,083 41,061 26,262 67,323
Customer accounts 172,563 4,110 2,360 3,352 400 28,140 210,925 26,038 236,963
Debt securities in issue 27,254 2,567 4,428 4,804 846 — 39,899 1,117 41,016
Subordinated liabilities 3,583 601 104 1,762 10,889 — 16,939 59 16,998
Other liabilities 5 5 9 37 126 26,893 27,075 37,801 64,876
Shareholders’ funds —————27,018 27,018 1,081 28,099
Internal funding of trading book (22,447) (1,060) (1,239) (379) (197) — (25,322) 25,322 —
Total liabilities 218,628 7,401 6,070 9,884 12,478 83,134 337,595 117,680 455,275
Off-balance sheet items (7,943) (1,122) 3,597 964 4,504 —
Interest rate sensitivity gap (40,596) 9,683 15,313 24,719 21,696 (30,815)
Cumulative interest rate sensitivity gap (40,596) (30,913) (15,600) 9,119 30,815
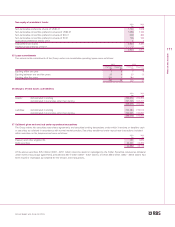
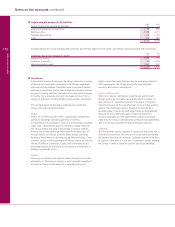
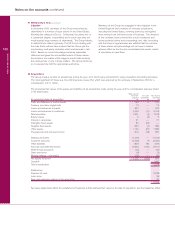
The Group’s objectives and policies in managing the risks that
arise in connection with the use of financial instruments are set
out in the Operating and financial review under ‘Market risk’,
‘Currency risk’ and ‘Equity risk’.
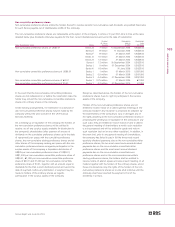
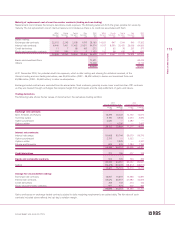
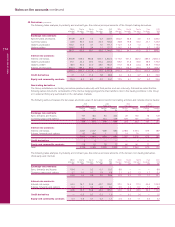
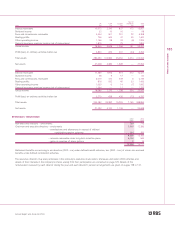
Interest rate sensitivity gap
The tables below summarise the Group’s interest rate
sensitivity gap for its non-trading book at 31 December 2003
and 31 December 2002. The tables show the contractual re-
pricing for each category of asset, liability and for off-balance
sheet items. A liability (or negative) gap position exists when
liabilities reprice more quickly or in greater proportion than
assets during a given period and tends to benefit net interest
income in a declining interest rate environment. An asset (or
positive) gap position exists when assets reprice more quickly
or in greater proportion than liabilities during a given period
and tends to benefit net interest income in a rising interest rate
environment. Contractual repricing terms do not reflect the
potential impact of early repayment or withdrawal. Positions
may not be reflective of those in subsequent periods. Major
changes in positions can be made promptly as market outlooks
change. In addition, significant variations in interest rate sensitivity
may exist within the re-pricing periods presented and among
the currencies in which the Group has interest rate positions.
40 Financial instruments