RBS 2003 Annual Report Download - page 179
Download and view the complete annual report
Please find page 179 of the 2003 RBS annual report below. You can navigate through the pages in the report by either clicking on the pages listed below, or by using the keyword search tool below to find specific information within the annual report.-
 1
1 -
2
-
3
-
4
-
5
-
6
-
7
-
8
-
9
-
10
-
11
-
12
-
13
-
14
-
15
-
16
-
17
-
18
-
19
-
20
-
21
-
22
-
23
-
24
-
25
-
26
-
27
-
28
-
29
-
30
-
31
-
32
-
33
-
34
-
35
-
36
-
37
-
38
-
39
-
40
-
41
-
42
-
43
-
44
-
45
-
46
-
47
-
48
-
49
-
50
-
51
-
52
-
53
-
54
-
55
-
56
-
57
-
58
-
59
-
60
-
61
-
62
-
63
-
64
-
65
-
66
-
67
-
68
-
69
-
70
-
71
-
72
-
73
-
74
-
75
-
76
-
77
-
78
-
79
-
80
-
81
-
82
-
83
-
84
-
85
-
86
-
87
-
88
-
89
-
90
-
91
-
92
-
93
-
94
-
95
-
96
-
97
-
98
-
99
-
100
-
101
-
102
-
103
-
104
-
105
-
106
-
107
-
108
-
109
-
110
-
111
-
112
-
113
-
114
-
115
-
116
-
117
-
118
-
119
-
120
-
121
-
122
-
123
-
124
-
125
-
126
-
127
-
128
-
129
-
130
-
131
-
132
-
133
-
134
-
135
-
136
-
137
-
138
-
139
-
140
-
141
-
142
-
143
-
144
-
145
-
146
-
147
-
148
-
149
-
150
-
151
-
152
-
153
-
154
-
155
-
156
-
157
-
158
-
159
-
160
-
161
-
162
-
163
-
164
-
165
-
166
-
167
-
168
-
 169
169 -
 170
170 -
 171
171 -
 172
172 -
 173
173 -
 174
174 -
 175
175 -
 176
176 -
 177
177 -
 178
178 -
 179
179 -
 180
180 -
 181
181 -
 182
182 -
 183
183 -
 184
184 -
 185
185 -
 186
186 -
 187
187 -
 188
188 -
 189
189 -
190
-
191
-
192
-
193
-
194
-
195
-
196
-
197
-
198
-
199
-
200
-
201
-
202
-
203
-
204
-
205
-
206
-
207
-
208
-
209
-
210
-
211
-
212
-
213
-
214
-
215
-
216
-
217
-
218
-
219
-
220
-
221
-
222
-
223
-
224
-
225
-
226
-
227
-
228
-
229
-
230
 |
 |

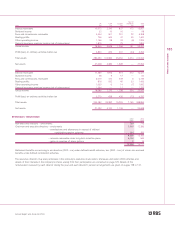
177
Annual Report and Accounts 2003
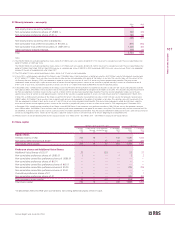
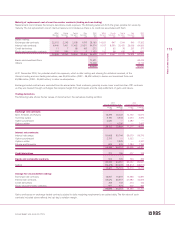
Notes on the accounts
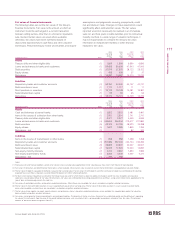
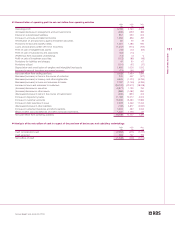
2003 2003 2002 2002
Carrying Fair Carrying Fair
amount value amount value
Trading business Note £m £m £m £m
Assets
Treasury bills and other eligible bills (1) 1,869 1,869 6,890 6,890
Loans and advances to banks and customers (1) 59,608 59,608 47,943 47,943
Debt securities (1) 37,575 37,575 28,122 28,122
Equity shares (1) 428 428 37 37
Derivatives (2) 14,087 14,087 13,210 13,210
Liabilities
Deposits by banks and customer accounts (3) 52,300 52,300 43,737 43,737
Debt securities in issue (1) 1,117 1,117 11 11
Short positions in securities (1) 19,128 19,128 16,381 16,381
Subordinated loan capital (1) 59 59 65 65
Derivatives (2) 15,173 15,173 14,729 14,729
2003 2003 2002 2002
Carrying Fair Carrying Fair
amount value amount value
Banking business Note £m £m £m £m
Assets
Cash and balances at central banks (1) 3,822 3,822 3,481 3,481
Items in the course of collection from other banks (1) 2,501 2,501 2,741 2,741
Treasury bills and other eligible bills (1) 2,977 2,977 4,569 4,569
Loans and advances to banks and customers (4) 244,814 246,244 219,677 221,883
Debt securities (5) 42,374 42,195 38,920 39,288
Equity shares (5) 1,872 2,289 1,849 1,765
Derivatives – net (2) 82 342
Liabilities
Items in the course of transmission to other banks (1) 958 958 1,258 1,258
Deposits by banks and customer accounts (3) 251,986 252,360 230,144 230,266
Debt securities in issue (6) 39,899 39,897 33,927 33,941
Subordinated loan capital (7) 16,939 17,522 13,900 14,890
Non-equity minority interests (7) 2,724 2,867 1,850 1,984
Non-equity shareholders’ funds (7) 2,923 3,245 3,507 5,277
Derivatives – net (7) 297 266
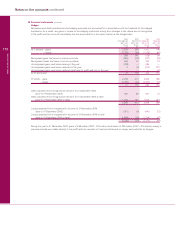
Notes:
(1) Financial assets and financial liabilities carried at fair value or where carrying value approximates to fair value because they are of short maturity or repricing date.
(2) Fair values of derivatives are determined by market prices where available. Otherwise fair value is based on current market information using appropriate valuation models.
(3) The fair value of deposits repayable on demand is equal to their carrying value. The fair values of term deposits and time certificates of deposit are estimated by discounting
expected future cash flows using rates currently offered for deposits of similar remaining maturities.
(4) For loans which reprice frequently or are linked to the Group’s base rate, and for which there has been no significant change in credit risk since inception, carrying value
represents a reasonable estimate of fair value. For other loans, fair values are estimated by discounting expected future cash flows, using current interest rates appropriate to the
type of loan, and making adjustments for credit risk.
(5) Fair values of marketable securities are based on quoted market prices. Where these are unavailable, fair value is estimated using other valuation techniques.
(6) The fair value of short-term debt securities in issue is approximately equal to their carrying value. The fair value of other debt securities in issue is based on quoted market
prices where available, or where these are unavailable, is estimated using other valuation techniques.
(7) The fair value of loan capital, non-equity minority interests and preference shares is based on quoted market prices where available. For unquoted loan capital, fair value has
been estimated using other valuation techniques.
(8) Fair values are not given for financial commitments and contingent liabilities. The diversity of the fee structures, the lack of an established market and the difficulty of separating
the value of the instruments from the value of the overall relationship involve such uncertainty that it is not meaningful to provide an estimate of their fair value. (The principal
amounts of these instruments are given in Note 41).
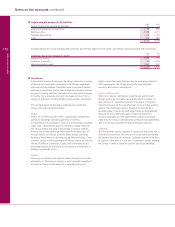
Fair values of financial instruments
The following tables set out the fair values of the Group’s
financial instruments. Fair value is the amount at which an
instrument could be exchanged in a current transaction
between willing parties, other than in a forced or liquidation
sale. Quoted market values are used where available;
otherwise, fair values have been estimated based on
discounted expected future cash flows and other valuation
techniques. These techniques involve uncertainties and require
assumptions and judgements covering prepayments, credit
risk and discount rates. Changes in these assumptions would
significantly affect estimated fair values. The fair values
reported would not necessarily be realised in an immediate
sale; nor are there plans to settle liabilities prior to contractual
maturity. As there is a wide range of valuation techniques, it
may be inappropriate to compare the Group’s fair value
information to independent markets or other financial
institutions’ fair value.