RBS 2003 Annual Report Download - page 84
Download and view the complete annual report
Please find page 84 of the 2003 RBS annual report below. You can navigate through the pages in the report by either clicking on the pages listed below, or by using the keyword search tool below to find specific information within the annual report.-
 1
1 -
2
-
3
-
4
-
5
-
6
-
7
-
8
-
9
-
10
-
11
-
12
-
13
-
14
-
15
-
16
-
17
-
18
-
19
-
20
-
21
-
22
-
23
-
24
-
25
-
26
-
27
-
28
-
29
-
30
-
31
-
32
-
33
-
34
-
35
-
36
-
37
-
38
-
39
-
40
-
41
-
42
-
43
-
44
-
45
-
46
-
47
-
48
-
49
-
50
-
51
-
52
-
53
-
54
-
55
-
56
-
57
-
58
-
59
-
60
-
61
-
62
-
63
-
64
-
65
-
66
-
67
-
68
-
69
-
70
-
71
-
72
-
73
-
 74
74 -
 75
75 -
 76
76 -
 77
77 -
 78
78 -
 79
79 -
 80
80 -
 81
81 -
 82
82 -
 83
83 -
 84
84 -
 85
85 -
 86
86 -
 87
87 -
 88
88 -
 89
89 -
 90
90 -
 91
91 -
 92
92 -
 93
93 -
 94
94 -
95
-
96
-
97
-
98
-
99
-
100
-
101
-
102
-
103
-
104
-
105
-
106
-
107
-
108
-
109
-
110
-
111
-
112
-
113
-
114
-
115
-
116
-
117
-
118
-
119
-
120
-
121
-
122
-
123
-
124
-
125
-
126
-
127
-
128
-
129
-
130
-
131
-
132
-
133
-
134
-
135
-
136
-
137
-
138
-
139
-
140
-
141
-
142
-
143
-
144
-
145
-
146
-
147
-
148
-
149
-
150
-
151
-
152
-
153
-
154
-
155
-
156
-
157
-
158
-
159
-
160
-
161
-
162
-
163
-
164
-
165
-
166
-
167
-
168
-
169
-
170
-
171
-
172
-
173
-
174
-
175
-
176
-
177
-
178
-
179
-
180
-
181
-
182
-
183
-
184
-
185
-
186
-
187
-
188
-
189
-
190
-
191
-
192
-
193
-
194
-
195
-
196
-
197
-
198
-
199
-
200
-
201
-
202
-
203
-
204
-
205
-
206
-
207
-
208
-
209
-
210
-
211
-
212
-
213
-
214
-
215
-
216
-
217
-
218
-
219
-
220
-
221
-
222
-
223
-
224
-
225
-
226
-
227
-
228
-
229
-
230
 |
 |

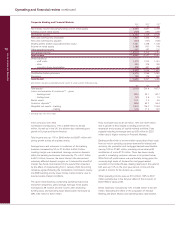
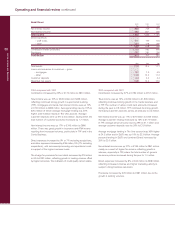
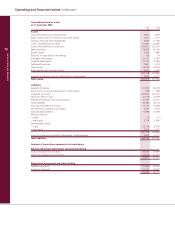
Wealth Management
2003 2002* 2001*
£m £m £m
Net interest income 465 460 464
Non-interest income 414 447 469
Total income 879 907 933
Expenses
– staff costs 275 301 282
– other 157 163 175
432 464 457
Contribution before provisions 447 443 476
Provisions for bad and doubtful debts – charge/(release) 9 (11) (5)
Contribution 438 454 481
£bn £bn £bn
Total assets 15.2 13.4 12.5
Investment management assets – excluding deposits 27.3 20.5 21.4
Customer deposits 29.3 29.1 29.1
Weighted risk assets 9.1 8.4 7.8
* Prior periods have been restated following the transfer of certain activities to Manufacturing.
2003 compared with 2002
Contribution was £438 million, £16 million or 4% lower than 2002.
Excluding the acquisition and disposals, income was up 1%,
with contribution before provisions up 4%. The charge for
provisions for bad and doubtful debts was £9 million compared
with a net release of £11 million in 2002.
Total income was down by 3% or £28 million to £879 million.
Net interest income increased by 1% or £5 million to £465
million. The benefit from growth in lending volumes was partly
negated by the effect of lower interest rates which also caused
a tightening of deposit margins.
Non-interest income declined by 7% or £33 million to £414 million.
Excluding the acquisition and disposals the decrease was 1%.
This reflects the impact of lower equity markets adversely
affecting fees and commissions.
Investment management assets increased by £6.8 billion or
33% to £27.3 billion principally due to the acquisition of Bank
von Ernst in the year.
Expenses were down by 7% or £32 million to £432 million
reflecting tight cost control in difficult market conditions and
the 7% reduction in staff numbers since 31 December 2002.
Provisions for bad and doubtful debts were £9 million
compared with a net release of £11 million in 2002.
2002 compared with 2001
Contribution at £454 million was £27 million, 6% lower primarily
due to the effect of the fall in equity markets on the level of
activity and ad valorem fee income.
Total income was down 3% or £26 million to £907 million.
Net interest income declined by 1% or £4 million to £460 million,
as a result of a slight contraction in deposit margins due to
lower interest rates. Average customer deposits increased from
£28.5 billion to £28.7 billion.
Non-interest income was £22 million, 5% lower at £447 million.
This reflected lower equity markets which continued adversely
to affect fees and commissions. Investment management
assets at £20.5 billion were £0.9 billion, 4% lower as new
business inflow was more than offset by the significant decline
in equity markets.
Expenses were up 2% or £7 million to £464 million.
Releases and recoveries of provisions exceeded gross new
provisions required. As a result, there was a net release of
provisions of £11 million, against a net release of £5 million
in 2001.
Operating and financial review continued
82
Operating and financial review