RBS 2003 Annual Report Download - page 205
Download and view the complete annual report
Please find page 205 of the 2003 RBS annual report below. You can navigate through the pages in the report by either clicking on the pages listed below, or by using the keyword search tool below to find specific information within the annual report.-
 1
1 -
2
-
3
-
4
-
5
-
6
-
7
-
8
-
9
-
10
-
11
-
12
-
13
-
14
-
15
-
16
-
17
-
18
-
19
-
20
-
21
-
22
-
23
-
24
-
25
-
26
-
27
-
28
-
29
-
30
-
31
-
32
-
33
-
34
-
35
-
36
-
37
-
38
-
39
-
40
-
41
-
42
-
43
-
44
-
45
-
46
-
47
-
48
-
49
-
50
-
51
-
52
-
53
-
54
-
55
-
56
-
57
-
58
-
59
-
60
-
61
-
62
-
63
-
64
-
65
-
66
-
67
-
68
-
69
-
70
-
71
-
72
-
73
-
74
-
75
-
76
-
77
-
78
-
79
-
80
-
81
-
82
-
83
-
84
-
85
-
86
-
87
-
88
-
89
-
90
-
91
-
92
-
93
-
94
-
95
-
96
-
97
-
98
-
99
-
100
-
101
-
102
-
103
-
104
-
105
-
106
-
107
-
108
-
109
-
110
-
111
-
112
-
113
-
114
-
115
-
116
-
117
-
118
-
119
-
120
-
121
-
122
-
123
-
124
-
125
-
126
-
127
-
128
-
129
-
130
-
131
-
132
-
133
-
134
-
135
-
136
-
137
-
138
-
139
-
140
-
141
-
142
-
143
-
144
-
145
-
146
-
147
-
148
-
149
-
150
-
151
-
152
-
153
-
154
-
155
-
156
-
157
-
158
-
159
-
160
-
161
-
162
-
163
-
164
-
165
-
166
-
167
-
168
-
169
-
170
-
171
-
172
-
173
-
174
-
175
-
176
-
177
-
178
-
179
-
180
-
181
-
182
-
183
-
184
-
185
-
186
-
187
-
188
-
189
-
190
-
191
-
192
-
193
-
194
-
 195
195 -
 196
196 -
 197
197 -
 198
198 -
 199
199 -
 200
200 -
 201
201 -
 202
202 -
 203
203 -
 204
204 -
 205
205 -
 206
206 -
 207
207 -
 208
208 -
 209
209 -
 210
210 -
 211
211 -
 212
212 -
 213
213 -
 214
214 -
 215
215 -
216
-
217
-
218
-
219
-
220
-
221
-
222
-
223
-
224
-
225
-
226
-
227
-
228
-
229
-
230
 |
 |

203
Annual Report and Accounts 2003
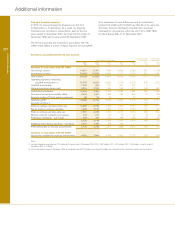
Additional information
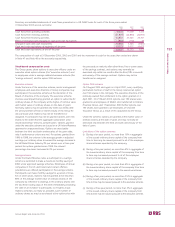
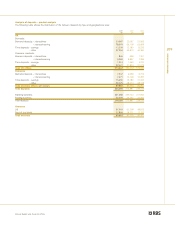
Other financial data
3 months ended Year ended
Year ended 31 December 31 December 30 September
2003 2002 2001 2000 1999 1999
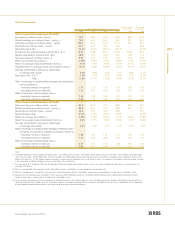
Other financial data based upon UK GAAP:
Earnings per ordinary share – pence 79.0 68.4 67.6 66.9 28.6 87.5
Diluted earnings per ordinary share – pence (1) 78.4 67.4 66.3 66.2 28.1 86.3
Adjusted earnings per ordinary share – pence 159.3 144.1 127.9 101.2 22.2 87.5
Dividends per ordinary share – pence 50.3 43.7 38.0 33.0 — 28.5
Dividend payout ratio 64.4% 64.3% 58.1% 56.1% — 32.9%
Share price per ordinary share at period end – £ (2) 16.46 14.88 16.72 15.82 10.98 13.03
Market capitalisation at period end – £bn 48.8 43.2 47.8 42.4 9.8 11.6
Net asset value per ordinary share – £ 8.50 8.12 7.79 7.08 3.35 3.09
Return on average total assets (3) 0.52% 0.50% 0.53% 0.58% 1.15% 0.92%
Return on average equity shareholders’ funds (4) 9.3% 8.4% 8.9% 9.9% 34.1% 32.0%
Adjusted return on average equity shareholders’ funds (5) 18.7% 17.6% 16.8% 14.9% 37.1% 33.2%
Average shareholders’ equity as a percentage
of average total assets 6.3% 6.9% 7.2% 7.2% 4.8% 4.1%
Risk asset ratio – Tier 1 7.4% 7.3% 7.1% 6.9% 7.7% 8.1%
Risk asset ratio – Total 11.8% 11.7% 11.5% 11.5% 11.2% 12.1%
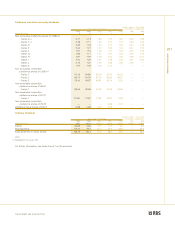
Ratio of earnings to combined fixed charges and preference
share dividends (6)
– including interest on deposits 1.97 1.73 1.49 1.32 1.46 1.33
– excluding interest on deposits 7.16 5.12 4.45 3.49 4.77 3.99
Ratio of earnings to fixed charges only (6)
– including interest on deposits 2.05 1.82 1.55 1.37 1.52 1.37
– excluding interest on deposits 9.85 7.13 6.52 4.81 6.63 5.06
Other financial data based upon US GAAP:
Basic earnings per ordinary share – pence 87.5 107.9 74.7 89.5 26.8 76.7
Diluted earnings per ordinary share – pence (1) 86.8 106.3 73.2 88.5 26.4 75.7
Dividends per ordinary share – pence 45.6 39.7 34.5 29.8 — 25.7
Dividend payout ratio 51.9% 36.7% 45.7% 20.6% — 33.5%
Return on average total assets (3) 0.55% 0.75% 0.57% 0.77% 0.27% 0.78%
Return on average equity shareholders’ funds (4) 9.5% 12.1% 8.8% 12.0% 6.3% 19.9%
Average shareholders’ equity as a percentage
of average total assets 6.5% 7.3% 7.7% 7.7% 5.7% 5.2%
Ratio of earnings to combined fixed charges, preference share
dividends and perpetual regulatory securities interest (6)
– including interest on deposits 1.98 1.97 1.51 1.41 1.45 1.31
– excluding interest on deposits 7.24 6.49 4.63 4.19 4.65 3.73
Ratio of earnings to fixed charges only (6)
– including interest on deposits 2.07 2.07 1.59 1.46 1.50 1.34
– excluding interest on deposits 9.96 9.03 6.98 5.77 6.46 4.73
Notes:
(1) Convertible preference shares totalling £200 million (2002 – £200 million; 2001 and 2000 – £800 million), 750 million (2002, 2001 and 2000 – 750 million) and $1,900 million
(2002, 2001 and 2000 – $1,900 million) have not been included in the computation of diluted earnings per share as their effect is anti-dilutive. Interest payments on the $1,200
million (2002 and 2001 – $1,200 million) perpetual regulatory securities may be settled by the issue of ordinary shares at the option of the company and have not been included
in the computation of diluted earnings per share as their effect is also anti-dilutive.
(2) The share prices at 31 December 1999 and 30 September 1999 have not been adjusted for the bonus issue in July 2000, of Additional Value Shares in connection with the
acquisition of NatWest.
(3) Return on average total assets represents profit attributable to ordinary shareholders as a percentage of average total assets.
(4) Return on average equity shareholders’ funds represents profit attributable to ordinary shareholders expressed as a percentage of average equity shareholders’ funds.
(5) Adjusted return on average equity shareholders’ funds represents profit attributable to ordinary shareholders before integration costs, goodwill amortisation and the AVS
dividend, expressed as a percentage of average equity shareholders’ funds.
(6) For this purpose, earnings consist of income before tax and minority interests, plus fixed charges less the unremitted income of associated undertakings (share of profits less
dividends received). Fixed charges consist of total interest expense, including or excluding interest on deposits and debt securities in issue, as appropriate, and the proportion
of rental expense deemed representative of the interest factor (one third of total rental expenses).