RBS 2003 Annual Report Download - page 65
Download and view the complete annual report
Please find page 65 of the 2003 RBS annual report below. You can navigate through the pages in the report by either clicking on the pages listed below, or by using the keyword search tool below to find specific information within the annual report.-
 1
1 -
2
-
3
-
4
-
5
-
6
-
7
-
8
-
9
-
10
-
11
-
12
-
13
-
14
-
15
-
16
-
17
-
18
-
19
-
20
-
21
-
22
-
23
-
24
-
25
-
26
-
27
-
28
-
29
-
30
-
31
-
32
-
33
-
34
-
35
-
36
-
37
-
38
-
39
-
40
-
41
-
42
-
43
-
44
-
45
-
46
-
47
-
48
-
49
-
50
-
51
-
52
-
53
-
54
-
 55
55 -
 56
56 -
 57
57 -
 58
58 -
 59
59 -
 60
60 -
 61
61 -
 62
62 -
 63
63 -
 64
64 -
 65
65 -
 66
66 -
 67
67 -
 68
68 -
 69
69 -
 70
70 -
 71
71 -
 72
72 -
 73
73 -
 74
74 -
 75
75 -
76
-
77
-
78
-
79
-
80
-
81
-
82
-
83
-
84
-
85
-
86
-
87
-
88
-
89
-
90
-
91
-
92
-
93
-
94
-
95
-
96
-
97
-
98
-
99
-
100
-
101
-
102
-
103
-
104
-
105
-
106
-
107
-
108
-
109
-
110
-
111
-
112
-
113
-
114
-
115
-
116
-
117
-
118
-
119
-
120
-
121
-
122
-
123
-
124
-
125
-
126
-
127
-
128
-
129
-
130
-
131
-
132
-
133
-
134
-
135
-
136
-
137
-
138
-
139
-
140
-
141
-
142
-
143
-
144
-
145
-
146
-
147
-
148
-
149
-
150
-
151
-
152
-
153
-
154
-
155
-
156
-
157
-
158
-
159
-
160
-
161
-
162
-
163
-
164
-
165
-
166
-
167
-
168
-
169
-
170
-
171
-
172
-
173
-
174
-
175
-
176
-
177
-
178
-
179
-
180
-
181
-
182
-
183
-
184
-
185
-
186
-
187
-
188
-
189
-
190
-
191
-
192
-
193
-
194
-
195
-
196
-
197
-
198
-
199
-
200
-
201
-
202
-
203
-
204
-
205
-
206
-
207
-
208
-
209
-
210
-
211
-
212
-
213
-
214
-
215
-
216
-
217
-
218
-
219
-
220
-
221
-
222
-
223
-
224
-
225
-
226
-
227
-
228
-
229
-
230
 |
 |

63
Operating and financial review
Annual Report and Accounts 2003
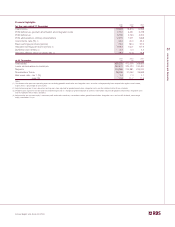
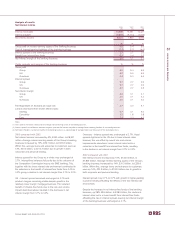
2003 compared with 2002
Profit
Profit before tax, goodwill amortisation and integration costs
increased by 11% or £700 million, from £6,451 million to
£7,151 million.
Profit before tax was up 29%, from £4,763 million to £6,159 million.
Total income
The Group achieved strong growth in income during 2003.
Total income was up 14% or £2,414 million to £19,229 million.
Non-interest income now accounts for 57% of total income.
Excluding acquisitions, total income rose by 10%.
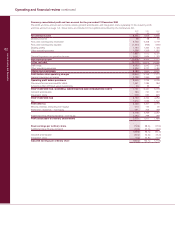
Net interest income increased by 6% to £8,301 million and
represents 43% of total income (2002 – 47%). Average loans
and advances to customers and average customer deposits
grew by 12% and 8% respectively. The benefit of this growth
has more than offset the impact on net interest income of the
Competition Commission inquiry into SME banking in the UK and
the lower interest rate environment in the UK and the US which
have reduced income earned from deposits and investments.
Non-interest income increased by 22% to £10,928 million and
represents 57% of total income (2002 – 53%). Fees receivable
were up 8% with good growth in lending, transmission and
card related fees reflecting higher volumes. General insurance
premium income grew strongly, reflecting volume growth in
both motor and home insurance products, and the acquisition
of Churchill. In addition, volumes in financial markets were up
strongly in both the UK and the US reflecting growth in
customer-driven activity in interest rate protection, mortgage
securitisation and foreign exchange. Income from rental assets
grew by 17% to £1,088 million, reflecting the growth in
operating leases and investment properties.
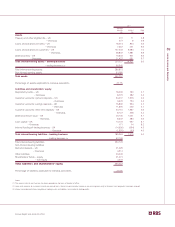
Net interest margin
The Group’s net interest margin at 3.0% was, in line with the
first half, down from 3.1% in 2002 due to a reduced benefit
from interest-free funds arising from the lower interest rate
environment, and the outcome of the Competition Commission
inquiry into SME banking.
Operating expenses
Operating expenses, excluding goodwill amortisation and
integration costs, rose by 9% to £8,389 million. Excluding
acquisitions, operating expenses were up 7% or £521 million in
support of higher business volumes and 10% income growth.
Cost:income ratio
The strong growth in income together with tight cost management
resulted in a further improvement in the Group’s ratio of
operating expenses (excluding goodwill amortisation and
integration costs and after netting operating lease depreciation
against rental income) to total income, to 42.0% from 44.0%.
Excluding the effect of acquisitions, the cost:income ratio
improved to 42.5%.
Net insurance claims
General insurance claims, after reinsurance, increased by 63%
to £2,195 million. Excluding Churchill, the increase was 29%,
consistent with volume growth in the component parts of the
insurance division.
Provisions
The profit and loss charge for bad debts and amounts written
off fixed asset investments was £1,494 million compared with
£1,345 million in 2002. The profit and loss charge is in line with
the growth in loans and advances.
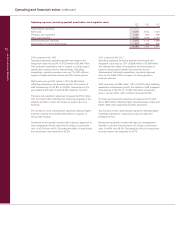
Credit quality
There has been no material change during the year in the
distribution by grade of the Group’s total risk assets.
The ratio of risk elements in lending to gross loans and
advances to customers at 2.01% at 31 December 2003
showed an improving trend (31 December 2002 – 2.14%).
Risk elements in lending and potential problem loans
represented 2.24% of gross loans and advances to customers
compared with 2.66% at 31 December 2002.
Integration
Integration costs in the year were £229 million, of which, £143
million related to the final elements of the NatWest integration
and £86 million related to other acquisitions, including Citizens’
acquisitions and Churchill.
All integration initiatives in relation to NatWest have been
implemented. The programme benefits, comprising £890
million annual revenue benefits and £1,440 million annual cost
savings, were fully implemented less than three years after the
acquisition of NatWest. Total costs for the integration
programme were £2.3 billion. Since 6 March 2000 the
integration initiatives have contributed a cumulative £5.6 billion
to the Group.
Earnings and dividends
Basic earnings per ordinary share increased by 15%, from
68.4p to 79.0p. Earnings per ordinary share, adjusted for
goodwill amortisation, integration costs and the dividend on
Additional Value Shares (“AVS”), increased by 11%, from
144.1p to 159.3p.
The final dividend of 55p per share amounting to £1.5 billion
was paid on 1 December 2003 to the holders of the AVS
issued in connection with the acquisition of NatWest. A total of
£1 per AVS amounting to £2.7 billion in aggregate has been
paid over three years to shareholders in accordance with the
original schedule.
A final dividend of 35.7p per ordinary share is recommended,
making a total for the year of 50.3p per share, an increase of
15%. If approved, the final dividend will be paid on 4 June
2004 to shareholders registered on 12 March 2004. The total
dividend is covered 3.1 times by earnings before goodwill
amortisation, integration costs and the AVS dividend.