RBS 2003 Annual Report Download - page 82
Download and view the complete annual report
Please find page 82 of the 2003 RBS annual report below. You can navigate through the pages in the report by either clicking on the pages listed below, or by using the keyword search tool below to find specific information within the annual report.-
 1
1 -
2
-
3
-
4
-
5
-
6
-
7
-
8
-
9
-
10
-
11
-
12
-
13
-
14
-
15
-
16
-
17
-
18
-
19
-
20
-
21
-
22
-
23
-
24
-
25
-
26
-
27
-
28
-
29
-
30
-
31
-
32
-
33
-
34
-
35
-
36
-
37
-
38
-
39
-
40
-
41
-
42
-
43
-
44
-
45
-
46
-
47
-
48
-
49
-
50
-
51
-
52
-
53
-
54
-
55
-
56
-
57
-
58
-
59
-
60
-
61
-
62
-
63
-
64
-
65
-
66
-
67
-
68
-
69
-
70
-
71
-
 72
72 -
 73
73 -
 74
74 -
 75
75 -
 76
76 -
 77
77 -
 78
78 -
 79
79 -
 80
80 -
 81
81 -
 82
82 -
 83
83 -
 84
84 -
 85
85 -
 86
86 -
 87
87 -
 88
88 -
 89
89 -
 90
90 -
 91
91 -
 92
92 -
93
-
94
-
95
-
96
-
97
-
98
-
99
-
100
-
101
-
102
-
103
-
104
-
105
-
106
-
107
-
108
-
109
-
110
-
111
-
112
-
113
-
114
-
115
-
116
-
117
-
118
-
119
-
120
-
121
-
122
-
123
-
124
-
125
-
126
-
127
-
128
-
129
-
130
-
131
-
132
-
133
-
134
-
135
-
136
-
137
-
138
-
139
-
140
-
141
-
142
-
143
-
144
-
145
-
146
-
147
-
148
-
149
-
150
-
151
-
152
-
153
-
154
-
155
-
156
-
157
-
158
-
159
-
160
-
161
-
162
-
163
-
164
-
165
-
166
-
167
-
168
-
169
-
170
-
171
-
172
-
173
-
174
-
175
-
176
-
177
-
178
-
179
-
180
-
181
-
182
-
183
-
184
-
185
-
186
-
187
-
188
-
189
-
190
-
191
-
192
-
193
-
194
-
195
-
196
-
197
-
198
-
199
-
200
-
201
-
202
-
203
-
204
-
205
-
206
-
207
-
208
-
209
-
210
-
211
-
212
-
213
-
214
-
215
-
216
-
217
-
218
-
219
-
220
-
221
-
222
-
223
-
224
-
225
-
226
-
227
-
228
-
229
-
230
 |
 |

Operating and financial review continued
80
Operating and financial review
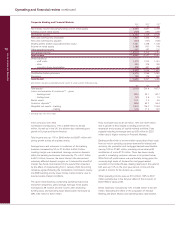
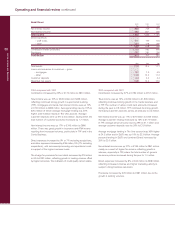
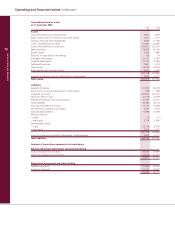
Retail Direct
2003 2002 2001
£m £m £m
Net interest income 849 749 674
Non-interest income 986 841 696
Total income 1,835 1,590 1,370
Direct expenses
– staff costs 211 190 164
– other 454 418 400
665 608 564
Contribution before provisions 1,170 982 806
Provisions 297 281 255
Contribution 873 701 551
£bn £bn £bn
Total assets 21.9 19.4 17.1
Loans and advances to customers – gross
– mortgages 8.2 7.0 5.9
– other 13.8 12.4 11.2
Customer deposits 4.4 4.4 4.3
Weighted risk assets 16.8 14.4 12.5
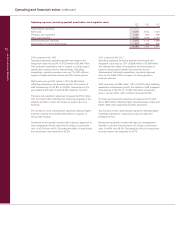
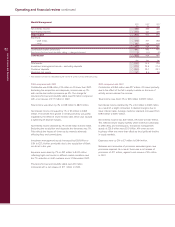
2003 compared with 2002
Contribution increased by 25% or £172 million to £873 million.
Total income was up 15% or £245 million to £1,835 million,
reflecting continued strong growth in supermarket banking
(TPF), mortgages and cards. Net interest income was up 13%
or £100 million to £849 million. Average lending rose by 15% to
£20.3 billion of which average mortgage lending was 20%
higher at £7.6 billion mainly in The One account. Average
customer deposits were up 5% to £4.4 billion. During 2003, the
total number of customer accounts increased by 1.7 million.
Non-interest income was up 17% or £145 million to £986
million. There was good growth in insurance and ATM income
resulting from increased volumes, particularly in TPF and in the
Cards Business.
Direct expenses increased by 9% or 7% excluding acquisitions,
and other expenses increased by £36 million, 9% (7% excluding
acquisitions), with increased processing and operational costs
in support of the higher business levels.
The charge for provisions for bad debts increased by £16 million
or 6% to £297 million, reflecting growth in lending volumes offset
by higher recoveries. The indicators of credit quality remain stable.
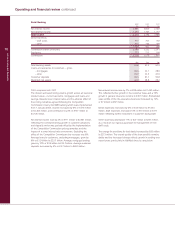
2002 compared with 2001
Contribution increased by 27% or £150 million to £701 million.
Total income was up 16% or £220 million to £1,590 million,
reflecting continued strong growth in the Cards business and
in TPF. The number of active credit card accounts increased
during the year to 9.5 million. TPF continued its strong growth,
increasing customer accounts across all products to 3.4 million.
Net interest income was up 11% or £75 million to £749 million.
Average customer lending increased by 16% to £17.9 billion.
In TPF, average personal loans rose by 29% to £1.1 billion and
average customer deposits rose by 26% to £1.9 billion.
Average mortgage lending in The One account was 36% higher
at £4.3 billion and in DLFS was up 10% to £2.3 billion. Average
personal lending in DLFS and Lombard Direct increased by
20% to £2.0 billion.
Non-interest income was up 21% or £145 million to £841 million
mainly as a result of higher fee income reflecting growth in
volumes, especially in TPF, where the total number of general
insurance policies increased during the year to 1.3 million.
Direct expenses increased by 8% or £44 million to £608 million
reflecting increased volumes and higher marketing activity to
support strong business expansion.
Provisions increased by £26 million to £281 million due to the
growth in lending volumes.