RBS 2003 Annual Report Download - page 178
Download and view the complete annual report
Please find page 178 of the 2003 RBS annual report below. You can navigate through the pages in the report by either clicking on the pages listed below, or by using the keyword search tool below to find specific information within the annual report.-
 1
1 -
2
-
3
-
4
-
5
-
6
-
7
-
8
-
9
-
10
-
11
-
12
-
13
-
14
-
15
-
16
-
17
-
18
-
19
-
20
-
21
-
22
-
23
-
24
-
25
-
26
-
27
-
28
-
29
-
30
-
31
-
32
-
33
-
34
-
35
-
36
-
37
-
38
-
39
-
40
-
41
-
42
-
43
-
44
-
45
-
46
-
47
-
48
-
49
-
50
-
51
-
52
-
53
-
54
-
55
-
56
-
57
-
58
-
59
-
60
-
61
-
62
-
63
-
64
-
65
-
66
-
67
-
68
-
69
-
70
-
71
-
72
-
73
-
74
-
75
-
76
-
77
-
78
-
79
-
80
-
81
-
82
-
83
-
84
-
85
-
86
-
87
-
88
-
89
-
90
-
91
-
92
-
93
-
94
-
95
-
96
-
97
-
98
-
99
-
100
-
101
-
102
-
103
-
104
-
105
-
106
-
107
-
108
-
109
-
110
-
111
-
112
-
113
-
114
-
115
-
116
-
117
-
118
-
119
-
120
-
121
-
122
-
123
-
124
-
125
-
126
-
127
-
128
-
129
-
130
-
131
-
132
-
133
-
134
-
135
-
136
-
137
-
138
-
139
-
140
-
141
-
142
-
143
-
144
-
145
-
146
-
147
-
148
-
149
-
150
-
151
-
152
-
153
-
154
-
155
-
156
-
157
-
158
-
159
-
160
-
161
-
162
-
163
-
164
-
165
-
166
-
167
-
 168
168 -
 169
169 -
 170
170 -
 171
171 -
 172
172 -
 173
173 -
 174
174 -
 175
175 -
 176
176 -
 177
177 -
 178
178 -
 179
179 -
 180
180 -
 181
181 -
 182
182 -
 183
183 -
 184
184 -
 185
185 -
 186
186 -
 187
187 -
 188
188 -
189
-
190
-
191
-
192
-
193
-
194
-
195
-
196
-
197
-
198
-
199
-
200
-
201
-
202
-
203
-
204
-
205
-
206
-
207
-
208
-
209
-
210
-
211
-
212
-
213
-
214
-
215
-
216
-
217
-
218
-
219
-
220
-
221
-
222
-
223
-
224
-
225
-
226
-
227
-
228
-
229
-
230
 |
 |

176
Notes on the accounts continued
Notes on the accounts
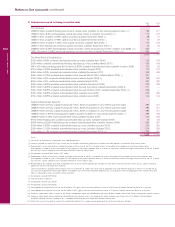
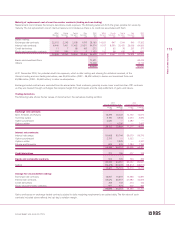
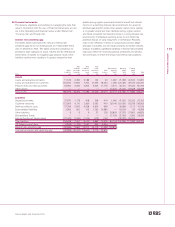
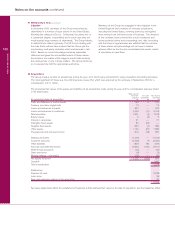
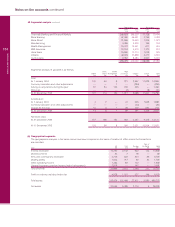
40 Financial instruments (continued)
After After After
3 months 6 months 1 year Non-interest Banking Trading
Within but within but within but within After bearing book book
3 months 6 months 1 year 5 years 5 years funds total total Total
2002 £m £m £m £m £m £m £m £m £m
Assets
Loans and advances to banks 14,208 4,572 2,569 2 26 482 21,859 22,437 44,296
Loans and advances to customers 139,822 12,547 9,134 25,023 10,228 1,064 197,818 25,506 223,324
Treasury bills and debt securities 23,498 4,529 3,693 6,639 5,130 — 43,489 35,012 78,501
Other assets —————48,322 48,322 17,557 65,879
Total assets 177,528 21,648 15,396 31,664 15,384 49,868 311,488 100,512 412,000
Liabilities
Deposits by banks 31,189 731 623 177 459 1,295 34,474 20,246 54,720
Customer accounts 158,253 3,747 2,146 3,232 373 27,919 195,670 23,491 219,161
Debt securities in issue 27,462 1,030 1,307 3,615 513 — 33,927 11 33,938
Subordinated liabilities 2,688 528 623 1,446 8,615 — 13,900 65 13,965
Other liabilities 3 11 15 14 128 27,418 27,589 35,575 63,164
Shareholders’ funds —————26,182 26,182 870 27,052
Internal funding of
trading business (19,634) — (620) — — — (20,254) 20,254 —
Total liabilities 199,961 6,047 4,094 8,484 10,088 82,814 311,488 100,512 412,000
Off-balance sheet items (1,762) (3,141) (1,946) 3,708 3,141 —
Interest rate sensitivity gap (24,195) 12,460 9,356 26,888 8,437 (32,946)
Cumulative interest rate
sensitivity gap (24,195) (11,735) (2,379) 24,509 32,946
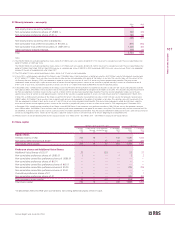
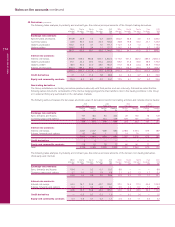
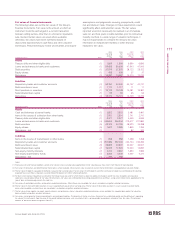
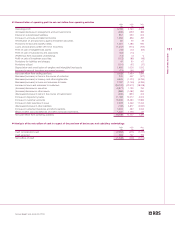
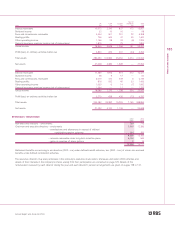
Currency risk
The Group does not maintain material non-trading open currency positions other than the structural foreign currency translation
exposures arising from its investment in overseas subsidiary and associated undertakings and their related funding.
The Group’s structural currency exposures were as follows:
Foreign 2003 Foreign 2002
Net currency Structural Net currency Structural
investments borrowings foreign investments borrowings foreign
in overseas hedging net currency in overseas hedging net currency
operations investments exposures operations investments exposures
Functional currency of net investment £m £m £m £m £m £m
US dollar 5,329 5,198 131 5,190 5,107 83
Euro 1,422 826 596 1,019 558 461
Swiss franc 357 357 — 306 295 11
Other non-sterling 118 114 4 35 30 5
Total 7,226 6,495 731 6,550 5,990 560
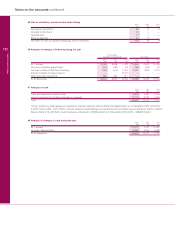
Trading book market risk
An explanation of the value-at-risk (“VaR”) methodology of estimating potential losses arising from the Group’s exposure to market
risk in its trading book and the main assumptions and parameters underlying it is given in ‘Risk management – market risk’ in the
Operating and financial review.
The following table analyses the VaR for the Group’s trading portfolios by type of market risk exposure at the period end and as an
average for the period and the maximum and minimum for the period:
31 December Year ended 31 December 2003 31 December Year ended 31 December 2002
2003 Maximum Minimum Average 2002 Maximum Minimum Average
£m £m £m £m £m £m £m £m
Interest rate 7.4 14.5 5.7 9.4 8.4 11.6 6.0 9.0
Currency 0.8 2.5 0.7 1.3 1.2 2.5 0.4 1.2
Equity 0.4 1.4 0.2 0.5 0.6 1.0 0.2 0.5
Diversification effects (1.2) (1.8)
Total 7.4 14.2 5.6 9.4 8.4 11.8 5.6 9.1