RBS 2003 Annual Report Download - page 175
Download and view the complete annual report
Please find page 175 of the 2003 RBS annual report below. You can navigate through the pages in the report by either clicking on the pages listed below, or by using the keyword search tool below to find specific information within the annual report.-
 1
1 -
2
-
3
-
4
-
5
-
6
-
7
-
8
-
9
-
10
-
11
-
12
-
13
-
14
-
15
-
16
-
17
-
18
-
19
-
20
-
21
-
22
-
23
-
24
-
25
-
26
-
27
-
28
-
29
-
30
-
31
-
32
-
33
-
34
-
35
-
36
-
37
-
38
-
39
-
40
-
41
-
42
-
43
-
44
-
45
-
46
-
47
-
48
-
49
-
50
-
51
-
52
-
53
-
54
-
55
-
56
-
57
-
58
-
59
-
60
-
61
-
62
-
63
-
64
-
65
-
66
-
67
-
68
-
69
-
70
-
71
-
72
-
73
-
74
-
75
-
76
-
77
-
78
-
79
-
80
-
81
-
82
-
83
-
84
-
85
-
86
-
87
-
88
-
89
-
90
-
91
-
92
-
93
-
94
-
95
-
96
-
97
-
98
-
99
-
100
-
101
-
102
-
103
-
104
-
105
-
106
-
107
-
108
-
109
-
110
-
111
-
112
-
113
-
114
-
115
-
116
-
117
-
118
-
119
-
120
-
121
-
122
-
123
-
124
-
125
-
126
-
127
-
128
-
129
-
130
-
131
-
132
-
133
-
134
-
135
-
136
-
137
-
138
-
139
-
140
-
141
-
142
-
143
-
144
-
145
-
146
-
147
-
148
-
149
-
150
-
151
-
152
-
153
-
154
-
155
-
156
-
157
-
158
-
159
-
160
-
161
-
162
-
163
-
164
-
 165
165 -
 166
166 -
 167
167 -
 168
168 -
 169
169 -
 170
170 -
 171
171 -
 172
172 -
 173
173 -
 174
174 -
 175
175 -
 176
176 -
 177
177 -
 178
178 -
 179
179 -
 180
180 -
 181
181 -
 182
182 -
 183
183 -
 184
184 -
 185
185 -
186
-
187
-
188
-
189
-
190
-
191
-
192
-
193
-
194
-
195
-
196
-
197
-
198
-
199
-
200
-
201
-
202
-
203
-
204
-
205
-
206
-
207
-
208
-
209
-
210
-
211
-
212
-
213
-
214
-
215
-
216
-
217
-
218
-
219
-
220
-
221
-
222
-
223
-
224
-
225
-
226
-
227
-
228
-
229
-
230
 |
 |

173
Annual Report and Accounts 2003
Notes on the accounts
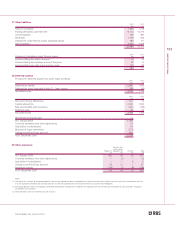
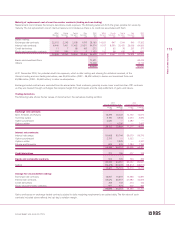
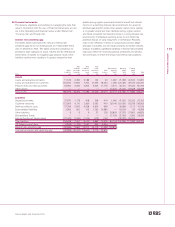
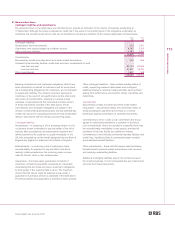
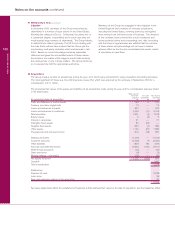
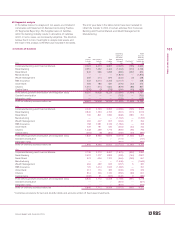
Maturity of replacement cost of over-the-counter contracts (trading and non-trading)
Replacement cost indicates the Group’s derivatives credit exposure. The following table sets forth the gross positive fair values by
maturity. The net replacement cost of internal trades is not included as there is no credit risk associated with them.
Within One to Two to Over 2003 Within One to Two to Over 2002
one year two years five years five years Total one year two years five years five years Total
£m £m £m £m £m £m £m £m £m £m
Before netting:
Exchange rate contracts 22,315 2,245 2,028 1,575 28,163 14,531 947 1,244 540 17,262
Interest rate contracts 8,440 7,401 17,462 21,671 54,974 9,037 8,590 20,420 26,036 64,083
Credit derivatives 11 7 85 169 272 2 62 76 237 377
Equity and commodity contracts 102 590 319 9 1,020 102 58 635 15 810
30,868 10,243 19,894 23,424 84,429 23,672 9,657 22,375 26,828 82,532
Banks and investment firms 70,421 69,416
Others 14,008 13,116
84,429 82,532
At 31 December 2003, the potential credit risk exposure, which is after netting and allowing for collateral received, of the
Group’s trading and non-trading derivatives, was £5,405 million (2002 – £5,428 million) to banks and investment firms and
£5,985 million (2002 – £5,482 million) to other counterparties.
Exchange traded contracts are excluded from the above table. Such contracts generally involve lower credit risk than OTC contracts
as they are cleared through exchanges that require margin from participants and the daily settlement of gains and losses.
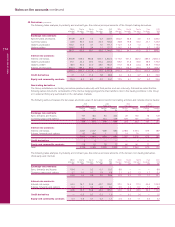
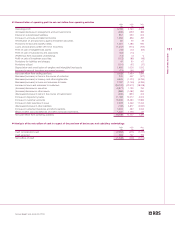
Trading derivatives
The following table shows the fair values of instruments in the derivatives trading portfolio:
2003 2002
End of period fair value End of period fair value
Assets Liabilities Assets Liabilities
£m £m £m £m
Exchange rate contracts:
Spot, forwards and futures 18,299 20,325 12,102 12,572
Currency swaps 5,183 4,944 2,633 3,596
Options purchased 4,620 — 2,482 —
Options written — 4,295 — 2,457
28,102 29,564 17,217 18,625
Interest rate contracts:
Interest rate swaps 50,838 50,744 59,079 59,776
Options purchased 2,799 — 3,332 —
Options written — 2,829 — 3,341
Futures and forwards 629 639 1,284 1,164
54,266 54,212 63,695 64,281
Credit derivatives 273 155 377 139
Equity and commodity contracts 924 720 733 496
83,565 84,651 82,022 83,541
Netting (69,478) (69,478) (68,812) (68,812)
14,087 15,173 13,210 14,729
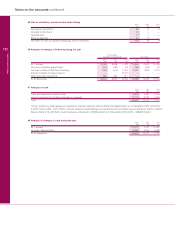
Average fair values (before netting):
Exchange rate contracts 18,967 19,619 13,565 14,581
Interest rate contracts 65,676 65,977 41,982 42,559
Credit derivatives 365 133 273 134
Equity and commodity contracts 877 624 545 483
85,885 86,353 56,365 57,757
Gains and losses on exchange traded contracts subject to daily margining requirements are settled daily. The fair value of such
contracts included above reflects the last day’s variation margin.