RBS 2003 Annual Report Download - page 185
Download and view the complete annual report
Please find page 185 of the 2003 RBS annual report below. You can navigate through the pages in the report by either clicking on the pages listed below, or by using the keyword search tool below to find specific information within the annual report.-
 1
1 -
2
-
3
-
4
-
5
-
6
-
7
-
8
-
9
-
10
-
11
-
12
-
13
-
14
-
15
-
16
-
17
-
18
-
19
-
20
-
21
-
22
-
23
-
24
-
25
-
26
-
27
-
28
-
29
-
30
-
31
-
32
-
33
-
34
-
35
-
36
-
37
-
38
-
39
-
40
-
41
-
42
-
43
-
44
-
45
-
46
-
47
-
48
-
49
-
50
-
51
-
52
-
53
-
54
-
55
-
56
-
57
-
58
-
59
-
60
-
61
-
62
-
63
-
64
-
65
-
66
-
67
-
68
-
69
-
70
-
71
-
72
-
73
-
74
-
75
-
76
-
77
-
78
-
79
-
80
-
81
-
82
-
83
-
84
-
85
-
86
-
87
-
88
-
89
-
90
-
91
-
92
-
93
-
94
-
95
-
96
-
97
-
98
-
99
-
100
-
101
-
102
-
103
-
104
-
105
-
106
-
107
-
108
-
109
-
110
-
111
-
112
-
113
-
114
-
115
-
116
-
117
-
118
-
119
-
120
-
121
-
122
-
123
-
124
-
125
-
126
-
127
-
128
-
129
-
130
-
131
-
132
-
133
-
134
-
135
-
136
-
137
-
138
-
139
-
140
-
141
-
142
-
143
-
144
-
145
-
146
-
147
-
148
-
149
-
150
-
151
-
152
-
153
-
154
-
155
-
156
-
157
-
158
-
159
-
160
-
161
-
162
-
163
-
164
-
165
-
166
-
167
-
168
-
169
-
170
-
171
-
172
-
173
-
174
-
 175
175 -
 176
176 -
 177
177 -
 178
178 -
 179
179 -
 180
180 -
 181
181 -
 182
182 -
 183
183 -
 184
184 -
 185
185 -
 186
186 -
 187
187 -
 188
188 -
 189
189 -
 190
190 -
 191
191 -
 192
192 -
 193
193 -
 194
194 -
 195
195 -
196
-
197
-
198
-
199
-
200
-
201
-
202
-
203
-
204
-
205
-
206
-
207
-
208
-
209
-
210
-
211
-
212
-
213
-
214
-
215
-
216
-
217
-
218
-
219
-
220
-
221
-
222
-
223
-
224
-
225
-
226
-
227
-
228
-
229
-
230
 |
 |

183
Annual Report and Accounts 2003
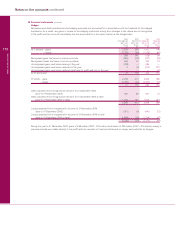
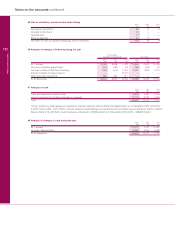
Notes on the accounts
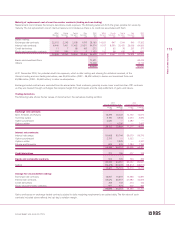
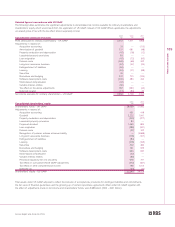
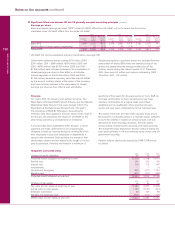
a) Classes of business
Operating Profit/
expenses (loss) on
Net and other ordinary
interest Non-interest Total operating activities
income income income charges Provisions* before tax
2003 £m £m £m £m £m £m
Corporate Banking and Financial Markets 2,324 4,373 6,697 (2,322) (755) 3,620
Retail Banking 2,951 1,452 4,403 (1,004) (273) 3,126
Retail Direct 849 986 1,835 (665) (297) 873
Manufacturing — — — (1,875) — (1,875)
Wealth Management 465 414 879 (432) (9) 438
RBS Insurance 232 3,013 3,245 (2,777) — 468
Ulster Bank 396 185 581 (276) (32) 273
Citizens 1,310 514 1,824 (879) (88) 857
Central items (226) (9) (235) (354) (40) (629)
Profit before goodwill amortisation and integration costs 8,301 10,928 19,229 (10,584) (1,494) 7,151
Goodwill amortisation — — — (763) — (763)
Integration costs — — — (229) — (229)
Profit on ordinary activities before tax 8,301 10,928 19,229 (11,576) (1,494) 6,159
2002
Corporate Banking and Financial Markets 2,349 3,703 6,052 (2,066) (725) 3,261
Retail Banking 2,840 1,353 4,193 (961) (213) 3,019
Retail Direct 749 841 1,590 (608) (281) 701
Manufacturing — — — (1,762) — (1,762)
Wealth Management 460 447 907 (464) 11 454
RBS Insurance 158 1,981 2,139 (1,784) — 355
Ulster Bank 339 181 520 (254) (22) 244
Citizens 1,248 468 1,716 (855) (95) 766
Central items (294) (8) (302) (265) (20) (587)
Profit before goodwill amortisation and integration costs 7,849 8,966 16,815 (9,019) (1,345) 6,451
Goodwill amortisation — — — (731) — (731)
Integration costs — — — (957) — (957)
Profit on ordinary activities before tax 7,849 8,966 16,815 (10,707) (1,345) 4,763
2001
Corporate Banking and Financial Markets 2,138 3,319 5,457 (1,875) (502) 3,080
Retail Banking 2,622 1,277 3,899 (928) (164) 2,807
Retail Direct 674 696 1,370 (564) (255) 551
Manufacturing — — — (1,646) — (1,646)
Wealth Management 464 469 933 (457) 5 481
RBS Insurance 129 1,414 1,543 (1,282) — 261
Ulster Bank 313 170 483 (239) (15) 229
Citizens 814 306 1,120 (550) (69) 501
Central items (308) 61 (247) (248) 9 (486)
Profit before goodwill amortisation and integration costs 6,846 7,712 14,558 (7,789) (991) 5,778
Goodwill amortisation — — — (651) — (651)
Integration costs — — — (875) — (875)
Profit on ordinary activities before tax 6,846 7,712 14,558 (9,315) (991) 4,252
* Comprises provisions for bad and doubtful debts and amounts written off fixed asset investments.
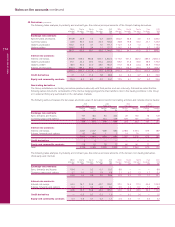
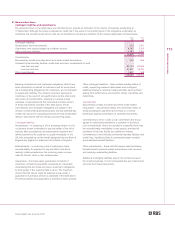
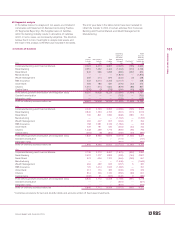
In the tables below, the analyses of net assets are included in
compliance with Statement of Standard Accounting Practice
25 ‘Segmental Reporting’. The fungible nature of liabilities
within the banking industry results in allocations of liabilities
which, in some cases, are necessarily subjective. The directors
believe that it is more meaningful to analyse total assets and
the result of this analysis is therefore also included in the tables.
The prior year data in the tables below have been restated to
reflect the transfer in 2003 of certain activities from Corporate
Banking and Financial Markets and Wealth Management to
Manufacturing.
49 Segmental analysis