RBS 2003 Annual Report Download - page 86
Download and view the complete annual report
Please find page 86 of the 2003 RBS annual report below. You can navigate through the pages in the report by either clicking on the pages listed below, or by using the keyword search tool below to find specific information within the annual report.-
 1
1 -
2
-
3
-
4
-
5
-
6
-
7
-
8
-
9
-
10
-
11
-
12
-
13
-
14
-
15
-
16
-
17
-
18
-
19
-
20
-
21
-
22
-
23
-
24
-
25
-
26
-
27
-
28
-
29
-
30
-
31
-
32
-
33
-
34
-
35
-
36
-
37
-
38
-
39
-
40
-
41
-
42
-
43
-
44
-
45
-
46
-
47
-
48
-
49
-
50
-
51
-
52
-
53
-
54
-
55
-
56
-
57
-
58
-
59
-
60
-
61
-
62
-
63
-
64
-
65
-
66
-
67
-
68
-
69
-
70
-
71
-
72
-
73
-
74
-
75
-
 76
76 -
 77
77 -
 78
78 -
 79
79 -
 80
80 -
 81
81 -
 82
82 -
 83
83 -
 84
84 -
 85
85 -
 86
86 -
 87
87 -
 88
88 -
 89
89 -
 90
90 -
 91
91 -
 92
92 -
 93
93 -
 94
94 -
 95
95 -
 96
96 -
97
-
98
-
99
-
100
-
101
-
102
-
103
-
104
-
105
-
106
-
107
-
108
-
109
-
110
-
111
-
112
-
113
-
114
-
115
-
116
-
117
-
118
-
119
-
120
-
121
-
122
-
123
-
124
-
125
-
126
-
127
-
128
-
129
-
130
-
131
-
132
-
133
-
134
-
135
-
136
-
137
-
138
-
139
-
140
-
141
-
142
-
143
-
144
-
145
-
146
-
147
-
148
-
149
-
150
-
151
-
152
-
153
-
154
-
155
-
156
-
157
-
158
-
159
-
160
-
161
-
162
-
163
-
164
-
165
-
166
-
167
-
168
-
169
-
170
-
171
-
172
-
173
-
174
-
175
-
176
-
177
-
178
-
179
-
180
-
181
-
182
-
183
-
184
-
185
-
186
-
187
-
188
-
189
-
190
-
191
-
192
-
193
-
194
-
195
-
196
-
197
-
198
-
199
-
200
-
201
-
202
-
203
-
204
-
205
-
206
-
207
-
208
-
209
-
210
-
211
-
212
-
213
-
214
-
215
-
216
-
217
-
218
-
219
-
220
-
221
-
222
-
223
-
224
-
225
-
226
-
227
-
228
-
229
-
230
 |
 |
Operating and financial review continued
84
Operating and financial review
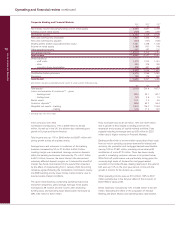
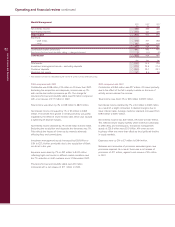
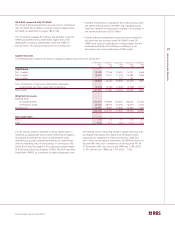
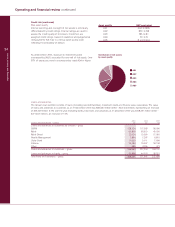
Ulster Bank
2003 2002 2001
£m £m £m
Net interest income 396 339 313
Non-interest income 185 181 170
Total income 581 520 483
Expenses
– staff costs 164 145 135
– other 112 109 104
276 254 239
Contribution before provisions 305 266 244
Provisions 32 22 15
Contribution 273 244 229
£bn £bn £bn
Total assets 15.6 12.7 10.8
Loans and advances to customers – gross 11.6 9.1 7.6
Customer deposits 9.7 8.8 7.7
Weighted risk assets 11.0 9.0 7.7
Average exchange rate – /£ 1.445 1.591 1.609
Spot exchange rate – /£ 1.416 1.536 1.637
2003 compared with 2002
Contribution increased by 12% or £29 million to £273 million
driven by strong volume growth in both loan and deposit products.
The number of customers increased in 2003 by 36,000.
Total income increased by 12% or £61 million to £581 million
reflecting the strong volume growth, in particular residential
mortgages.
Net interest income rose by 17% or £57 million to £396 million,
reflecting strong growth in both average customer lending and
deposits which increased by 26% or £2.1 billion, to £10.1
billion and by 13% or £1.0 billion, to £8.9 billion respectively.
Non-interest income increased by £4 million to £185 million.
Strong growth in lending, transmission and card fee income
was partially offset by lower dealing profits. Uncertainty in
equity markets adversely affected brokerage fees in the
stockbroking business which was sold in October 2003.
Expenses increased by 9% or £22 million to £276 million. This
reflected the annual pay award and the additional costs to
support increased business volumes.
The charge for provisions for bad debts was up £10 million to
£32 million reflecting growth in lending.
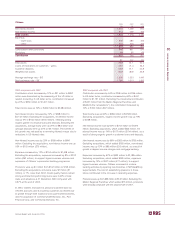
2002 compared with 2001
Contribution increased by 7%, or £15 million to £244 million.
Total income increased by 8%, £37 million to £520 million.
Net interest income rose by 8% or £26 million to £339 million,
reflecting good growth in loans and deposits despite a less
buoyant economic environment in the Republic of Ireland.
Average customer lending and deposits of the banking business
increased by 10%, £0.7 billion, to £8.0 billion, and by 7%, £0.5
billion, to £7.9 billion respectively. Average mortgage lending
grew by 23% to £1.5 billion and the number of current
accounts increased by 5%.
Non-interest income rose by 6% or £11 million to £181 million.
Increases of £7 million in net fees and commissions and £6
million in other operating income were partially offset by a £2
million reduction in dealing profits.
Expenses increased by 6% or £15 million to £254 million to
support higher business volumes and pay awards.
Provisions were up by £7 million to £22 million reflecting a
small number of specific situations.