RBS 2003 Annual Report Download - page 87
Download and view the complete annual report
Please find page 87 of the 2003 RBS annual report below. You can navigate through the pages in the report by either clicking on the pages listed below, or by using the keyword search tool below to find specific information within the annual report.-
 1
1 -
2
-
3
-
4
-
5
-
6
-
7
-
8
-
9
-
10
-
11
-
12
-
13
-
14
-
15
-
16
-
17
-
18
-
19
-
20
-
21
-
22
-
23
-
24
-
25
-
26
-
27
-
28
-
29
-
30
-
31
-
32
-
33
-
34
-
35
-
36
-
37
-
38
-
39
-
40
-
41
-
42
-
43
-
44
-
45
-
46
-
47
-
48
-
49
-
50
-
51
-
52
-
53
-
54
-
55
-
56
-
57
-
58
-
59
-
60
-
61
-
62
-
63
-
64
-
65
-
66
-
67
-
68
-
69
-
70
-
71
-
72
-
73
-
74
-
75
-
76
-
 77
77 -
 78
78 -
 79
79 -
 80
80 -
 81
81 -
 82
82 -
 83
83 -
 84
84 -
 85
85 -
 86
86 -
 87
87 -
 88
88 -
 89
89 -
 90
90 -
 91
91 -
 92
92 -
 93
93 -
 94
94 -
 95
95 -
 96
96 -
 97
97 -
98
-
99
-
100
-
101
-
102
-
103
-
104
-
105
-
106
-
107
-
108
-
109
-
110
-
111
-
112
-
113
-
114
-
115
-
116
-
117
-
118
-
119
-
120
-
121
-
122
-
123
-
124
-
125
-
126
-
127
-
128
-
129
-
130
-
131
-
132
-
133
-
134
-
135
-
136
-
137
-
138
-
139
-
140
-
141
-
142
-
143
-
144
-
145
-
146
-
147
-
148
-
149
-
150
-
151
-
152
-
153
-
154
-
155
-
156
-
157
-
158
-
159
-
160
-
161
-
162
-
163
-
164
-
165
-
166
-
167
-
168
-
169
-
170
-
171
-
172
-
173
-
174
-
175
-
176
-
177
-
178
-
179
-
180
-
181
-
182
-
183
-
184
-
185
-
186
-
187
-
188
-
189
-
190
-
191
-
192
-
193
-
194
-
195
-
196
-
197
-
198
-
199
-
200
-
201
-
202
-
203
-
204
-
205
-
206
-
207
-
208
-
209
-
210
-
211
-
212
-
213
-
214
-
215
-
216
-
217
-
218
-
219
-
220
-
221
-
222
-
223
-
224
-
225
-
226
-
227
-
228
-
229
-
230
 |
 |
85
Operating and financial review
Annual Report and Accounts 2003
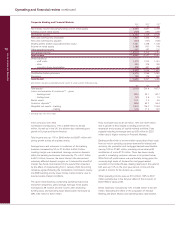
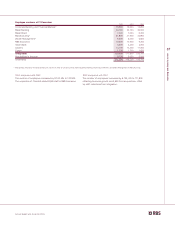
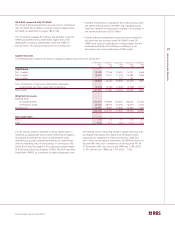
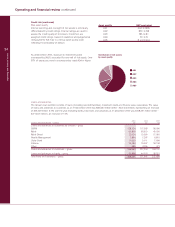
Citizens
2003 2002 2001
£m £m £m
Net interest income 1,310 1,248 814
Non-interest income 514 468 306
Total income 1,824 1,716 1,120
Expenses
– staff costs 505 485 305
– other 374 370 245
879 855 550
Contribution before provisions 945 861 570
Provisions 88 95 69
Contribution 857 766 501
$bn $bn $bn
Total assets 76.8 61.1 52.4
Loans and advances to customers – gross 43.5 31.4 26.3
Customer deposits 62.8 51.1 42.8
Weighted risk assets 50.8 38.8 35.8
Average exchange rate – $/£ 1.635 1.503 1.440
Spot exchange rate – $/£ 1.786 1.613 1.450
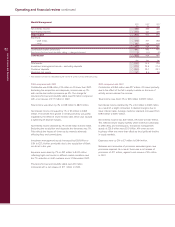
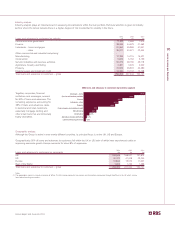
2003 compared with 2002
Contribution which increased by 12% or £91 million to £857
million was diminished by the weakening of the US dollar in
relation to sterling. In US dollar terms, contribution increased
by 22% or $250 million to $1,401 million.
Total income was up 16% or $406 million to $2,984 million.
Net interest income increased by 14% or $268 million to
$2,143 million. Excluding the acquisitions, net interest income
was up 9% or $164 million (£100 million), reflecting strong
organic growth in personal loans and deposits. Excluding the
acquisitions, average loans were up 29% or $8.0 billion and
average deposits were up 20% or $9.1 billion. The benefit of
this growth was reduced by a narrowing interest margin due to
reductions in US interest rates.
Non-interest income rose by 20% or $138 million to $841
million. Excluding the acquisitions, non-interest income was up
16% or $115 million (£70 million).
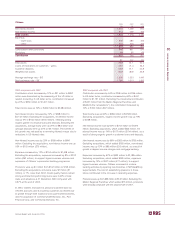
Expenses increased by 12% or $153 million to $1,438 million.
Excluding the acquisitions, expenses increased by 8% or $102
million (£62 million), to support higher business volumes and
expansion of Citizens’ supermarket banking programme.
Provisions were up $3 million from $142 million to $145 million.
Excluding the acquisitions, provisions were $2 million (£1
million), or 1%, lower than 2002. Credit quality metrics remain
strong and total non-performing loans were 0.40% of total
loans and advances at 31 December 2003 compared with
0.57% at the end of 2002.
In 2003, Citizens increased its personal customer base by
376,000 accounts and its business customers by 36,000 due
to growth through both traditional and supermarket branches,
and the acquisition of Commonwealth Bancorp, Inc., Port
Financial Corp. and Community Bancorp, Inc.
2002 compared with 2001
Contribution increased by 53% or £265 million to £766 million.
In US dollar terms, contribution increased by 60% or $431
million to $1,151 million. Excluding the incremental contribution
of $331 million from the Mellon Regional Franchise and
Medford (the “acquisitions”), the contribution increased by
14% or $100 million (£67 million).
Total income was up 60% or $966 million to $2,578 million.
Excluding acquisitions, organic income growth was up 15%
or $238 million.
Net interest income rose by 60% or $703 million to $1,875
million. Excluding acquisitions, which added $546 million, net
interest income was up 14% or $157 million (£104 million), as a
result of strong organic growth in customer loans and deposits.
Non-interest income rose by 60% or $263 million to $703 million.
Excluding acquisitions, which added $183 million, non-interest
income was up 19% or $80 million (£53 million), as a result of
growth in deposit service charges and mortgage banking.
Expenses increased by 62% or $492 million to $1,285 million.
Excluding acquisitions, which added $385 million, expenses
increased by 14% or $107 million (£71 million), to support
higher business volumes. Citizens increased its in-store
banking activities by opening new branches in 58 Stop&Shop
supermarkets. The cost of establishing presence in these
stores contributed to the increase in operating expenses.
Provisions were up from $99 million to $142 million. Excluding the
Mellon Regional Franchise which added $15 million, provisions
were broadly consistent with the second half of 2001.