RBS 2003 Annual Report Download - page 209
Download and view the complete annual report
Please find page 209 of the 2003 RBS annual report below. You can navigate through the pages in the report by either clicking on the pages listed below, or by using the keyword search tool below to find specific information within the annual report.-
 1
1 -
2
-
3
-
4
-
5
-
6
-
7
-
8
-
9
-
10
-
11
-
12
-
13
-
14
-
15
-
16
-
17
-
18
-
19
-
20
-
21
-
22
-
23
-
24
-
25
-
26
-
27
-
28
-
29
-
30
-
31
-
32
-
33
-
34
-
35
-
36
-
37
-
38
-
39
-
40
-
41
-
42
-
43
-
44
-
45
-
46
-
47
-
48
-
49
-
50
-
51
-
52
-
53
-
54
-
55
-
56
-
57
-
58
-
59
-
60
-
61
-
62
-
63
-
64
-
65
-
66
-
67
-
68
-
69
-
70
-
71
-
72
-
73
-
74
-
75
-
76
-
77
-
78
-
79
-
80
-
81
-
82
-
83
-
84
-
85
-
86
-
87
-
88
-
89
-
90
-
91
-
92
-
93
-
94
-
95
-
96
-
97
-
98
-
99
-
100
-
101
-
102
-
103
-
104
-
105
-
106
-
107
-
108
-
109
-
110
-
111
-
112
-
113
-
114
-
115
-
116
-
117
-
118
-
119
-
120
-
121
-
122
-
123
-
124
-
125
-
126
-
127
-
128
-
129
-
130
-
131
-
132
-
133
-
134
-
135
-
136
-
137
-
138
-
139
-
140
-
141
-
142
-
143
-
144
-
145
-
146
-
147
-
148
-
149
-
150
-
151
-
152
-
153
-
154
-
155
-
156
-
157
-
158
-
159
-
160
-
161
-
162
-
163
-
164
-
165
-
166
-
167
-
168
-
169
-
170
-
171
-
172
-
173
-
174
-
175
-
176
-
177
-
178
-
179
-
180
-
181
-
182
-
183
-
184
-
185
-
186
-
187
-
188
-
189
-
190
-
191
-
192
-
193
-
194
-
195
-
196
-
197
-
198
-
 199
199 -
 200
200 -
 201
201 -
 202
202 -
 203
203 -
 204
204 -
 205
205 -
 206
206 -
 207
207 -
 208
208 -
 209
209 -
 210
210 -
 211
211 -
 212
212 -
 213
213 -
 214
214 -
 215
215 -
 216
216 -
 217
217 -
 218
218 -
 219
219 -
220
-
221
-
222
-
223
-
224
-
225
-
226
-
227
-
228
-
229
-
230
 |
 |

207
Annual Report and Accounts 2003
Additional information
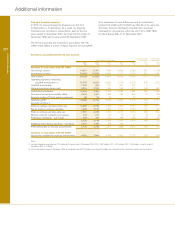
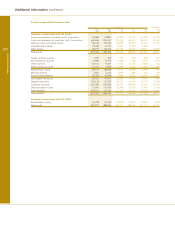
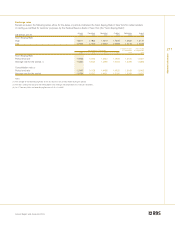
Analysis of write-offs
The following table analyses amounts written-off by geographical area and type of domestic customer.
31 December 30 September
2003 2002 2001 2000 1999
£m £m £m £m £m
Domestic
Manufacturing 99 111 61 55 4
Construction 22 18 19 30 5
Finance 54 35 8 5 1
Service industries and business activities 393 180 176 146 38
Agriculture, forestry and fishing 4 10 5 5 1
Property 6 9 14 7 4
Individuals – home mortgages 2 2 3 12 9
Individuals – others 357 333 297 230 107
Finance leases and instalment credit 160 45 62 109 6
Total domestic 1,097 743 645 599 175
Foreign 422 293 190 185 51
Total write-offs* 1,519 1,036 835 784 226
* Includes amounts written-off in respect of banks of nil (2002 – £1 million; 2001 – £6 million; 2000 – £5 million).
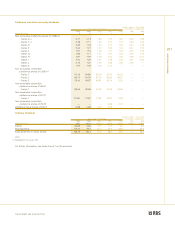
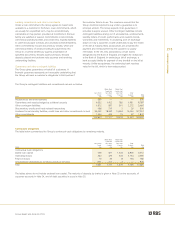
Analysis of recoveries
The following table analyses recoveries of amounts written-off by geographical area and type of domestic customer.
31 December 30 September
2003 2002 2001 2000 1999
£m £m £m £m £m
Domestic
Manufacturing — 1 2 12 2
Construction — — 1 13 1
Finance —— 1 3 8
Service industries and business activities 3 15 454
Agriculture, forestry and fishing — —— 3—
Property — 1 1 6 —
Individuals – home mortgages — ——— 1
Individuals – others 26 27 41 57 28
Finance leases and instalment credit 9 73 3 —
Total domestic 38 37 54 142 44
Foreign 34 26 26 22 10
Total recoveries 72 63 80 164 54