RBS 2003 Annual Report Download - page 63
Download and view the complete annual report
Please find page 63 of the 2003 RBS annual report below. You can navigate through the pages in the report by either clicking on the pages listed below, or by using the keyword search tool below to find specific information within the annual report.-
 1
1 -
2
-
3
-
4
-
5
-
6
-
7
-
8
-
9
-
10
-
11
-
12
-
13
-
14
-
15
-
16
-
17
-
18
-
19
-
20
-
21
-
22
-
23
-
24
-
25
-
26
-
27
-
28
-
29
-
30
-
31
-
32
-
33
-
34
-
35
-
36
-
37
-
38
-
39
-
40
-
41
-
42
-
43
-
44
-
45
-
46
-
47
-
48
-
49
-
50
-
51
-
52
-
 53
53 -
 54
54 -
 55
55 -
 56
56 -
 57
57 -
 58
58 -
 59
59 -
 60
60 -
 61
61 -
 62
62 -
 63
63 -
 64
64 -
 65
65 -
 66
66 -
 67
67 -
 68
68 -
 69
69 -
 70
70 -
 71
71 -
 72
72 -
 73
73 -
74
-
75
-
76
-
77
-
78
-
79
-
80
-
81
-
82
-
83
-
84
-
85
-
86
-
87
-
88
-
89
-
90
-
91
-
92
-
93
-
94
-
95
-
96
-
97
-
98
-
99
-
100
-
101
-
102
-
103
-
104
-
105
-
106
-
107
-
108
-
109
-
110
-
111
-
112
-
113
-
114
-
115
-
116
-
117
-
118
-
119
-
120
-
121
-
122
-
123
-
124
-
125
-
126
-
127
-
128
-
129
-
130
-
131
-
132
-
133
-
134
-
135
-
136
-
137
-
138
-
139
-
140
-
141
-
142
-
143
-
144
-
145
-
146
-
147
-
148
-
149
-
150
-
151
-
152
-
153
-
154
-
155
-
156
-
157
-
158
-
159
-
160
-
161
-
162
-
163
-
164
-
165
-
166
-
167
-
168
-
169
-
170
-
171
-
172
-
173
-
174
-
175
-
176
-
177
-
178
-
179
-
180
-
181
-
182
-
183
-
184
-
185
-
186
-
187
-
188
-
189
-
190
-
191
-
192
-
193
-
194
-
195
-
196
-
197
-
198
-
199
-
200
-
201
-
202
-
203
-
204
-
205
-
206
-
207
-
208
-
209
-
210
-
211
-
212
-
213
-
214
-
215
-
216
-
217
-
218
-
219
-
220
-
221
-
222
-
223
-
224
-
225
-
226
-
227
-
228
-
229
-
230
 |
 |
61
Operating and financial review
Annual Report and Accounts 2003
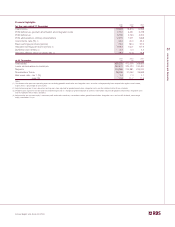
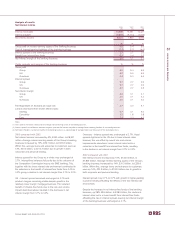
Financial highlights
2003 2002 2001
for the year ended 31 December £m £m £m
Total income 19,229 16,815 14,558
Profit before tax, goodwill amortisation and integration costs 7,151 6,451 5,778
Profit before tax 6,159 4,763 4,252
Profit attributable to ordinary shareholders 2,315 1,971 1,868
Cost:income ratio (%) (1) 42.0 44.0 45.3
Basic earnings per share (pence) 79.0 68.4 67.6
Adjusted earnings per share (pence) (2) 159.3 144.1 127.9
Dividend cover (times) (3) 3.1 3.3 3.3
Adjusted after-tax return on equity (%) (4) 18.7 17.6 16.8
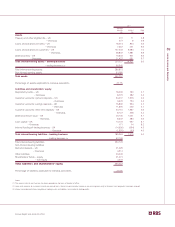
2003 2002 2001
at 31 December £m £m £m
Total assets 455,275 412,000 368,859
Loans and advances to customers 252,531 223,324 190,492
Deposits 304,286 273,881 239,033
Shareholders’ funds 28,099 27,052 26,668
Risk asset ratio – tier 1 (%) 7.4 7.3 7.1
– total (%) 11.8 11.7 11.5
Notes:
(1) Cost:income ratio represents operating expenses excluding goodwill amortisation and integration costs, and after netting operating lease depreciation against rental income,
expressed as a percentage of total income.
(2) Adjusted earnings per share is based on earnings per share adjusted for goodwill amortisation, integration costs and the Additional Value Shares dividend.
(3) Dividend cover represents the total ordinary dividend expressed as a multiple of profit attributable to ordinary shareholders adjusted for goodwill amortisation, integration costs
and the Additional Value Shares dividend.
(4) Adjusted after-tax return on equity is based on profit attributable to ordinary shareholders before goodwill amortisation, integration costs and the AVS dividend, and average
equity shareholders’ funds.