RBS 2003 Annual Report Download - page 191
Download and view the complete annual report
Please find page 191 of the 2003 RBS annual report below. You can navigate through the pages in the report by either clicking on the pages listed below, or by using the keyword search tool below to find specific information within the annual report.-
 1
1 -
2
-
3
-
4
-
5
-
6
-
7
-
8
-
9
-
10
-
11
-
12
-
13
-
14
-
15
-
16
-
17
-
18
-
19
-
20
-
21
-
22
-
23
-
24
-
25
-
26
-
27
-
28
-
29
-
30
-
31
-
32
-
33
-
34
-
35
-
36
-
37
-
38
-
39
-
40
-
41
-
42
-
43
-
44
-
45
-
46
-
47
-
48
-
49
-
50
-
51
-
52
-
53
-
54
-
55
-
56
-
57
-
58
-
59
-
60
-
61
-
62
-
63
-
64
-
65
-
66
-
67
-
68
-
69
-
70
-
71
-
72
-
73
-
74
-
75
-
76
-
77
-
78
-
79
-
80
-
81
-
82
-
83
-
84
-
85
-
86
-
87
-
88
-
89
-
90
-
91
-
92
-
93
-
94
-
95
-
96
-
97
-
98
-
99
-
100
-
101
-
102
-
103
-
104
-
105
-
106
-
107
-
108
-
109
-
110
-
111
-
112
-
113
-
114
-
115
-
116
-
117
-
118
-
119
-
120
-
121
-
122
-
123
-
124
-
125
-
126
-
127
-
128
-
129
-
130
-
131
-
132
-
133
-
134
-
135
-
136
-
137
-
138
-
139
-
140
-
141
-
142
-
143
-
144
-
145
-
146
-
147
-
148
-
149
-
150
-
151
-
152
-
153
-
154
-
155
-
156
-
157
-
158
-
159
-
160
-
161
-
162
-
163
-
164
-
165
-
166
-
167
-
168
-
169
-
170
-
171
-
172
-
173
-
174
-
175
-
176
-
177
-
178
-
179
-
180
-
 181
181 -
 182
182 -
 183
183 -
 184
184 -
 185
185 -
 186
186 -
 187
187 -
 188
188 -
 189
189 -
 190
190 -
 191
191 -
 192
192 -
 193
193 -
 194
194 -
 195
195 -
 196
196 -
 197
197 -
 198
198 -
 199
199 -
 200
200 -
 201
201 -
202
-
203
-
204
-
205
-
206
-
207
-
208
-
209
-
210
-
211
-
212
-
213
-
214
-
215
-
216
-
217
-
218
-
219
-
220
-
221
-
222
-
223
-
224
-
225
-
226
-
227
-
228
-
229
-
230
 |
 |
189
Annual Report and Accounts 2003
Notes on the accounts
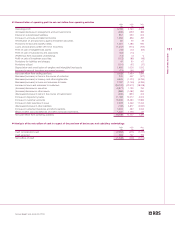
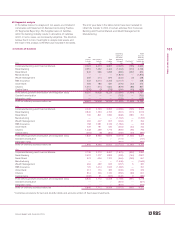
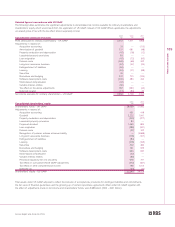
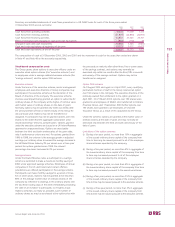
Selected figures in accordance with US GAAP
The following tables summarise the significant adjustments to consolidated net income available for ordinary shareholders and
shareholders’ equity which would result from the application of US GAAP instead of UK GAAP. Where applicable, the adjustments
are stated gross of tax with the tax effect shown separately in total.
2003 2002 2001
Consolidated statement of income £m £m £m
Profit attributable to ordinary shareholders – UK GAAP 2,315 1,971 1,868
Adjustments in respect of:
Acquisition accounting 33 — (113)
Amortisation of goodwill 721 681 (48)
Property revaluation and depreciation (41) (18) (12)
Leasehold property provisions 83 ——
Loan origination (47) (72) (95)
Pension costs (369) (58) 242
Long-term assurance business (57) (37) (25)
Extinguishment of liabilities (84) ——
Leasing (53) (71) (68)
Securities 49 ——
Derivatives and hedging 232 770 (125)
Software development costs (300) 283 442
Stock-based compensation (32) ——
Variable interest entities (60) ——
Tax effect on the above adjustments 187 (261) (44)
Deferred taxation (13) (80) 40
Net income available for ordinary shareholders – US GAAP 2,564 3,108 2,062
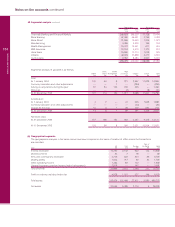
2003 2002
Consolidated shareholders’ equity £m £m
Shareholders’ funds – UK GAAP 28,099 27,052
Adjustments in respect of:
Acquisition accounting 451 418
Goodwill 2,222 1,541
Property revaluation and depreciation (249) (277)
Leasehold property provisions 83 —
Proposed dividend 1,059 899
Loan origination (288) (241)
Pension costs (27) 342
Recognition of pension scheme minimum liability — (3,568)
Long-term assurance business (178) (121)
Extinguishment of liabilities (84) —
Leasing (218) (165)
Securities 232 284
Derivatives and hedging 161 535
Software development costs 660 960
Stock-based compensation (32) —
Variable interest entities (60) —
Perpetual regulatory tier one securities 678 751
Tax effect on cumulative UK/US GAAP adjustments (274) (461)
Tax effect on other comprehensive income 155 1,013
Deferred tax (47) (34)
Shareholders’ equity – US GAAP 32,343 28,928
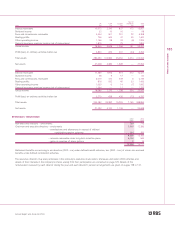
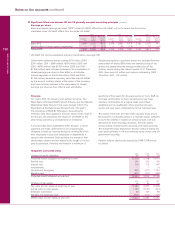
Total assets under US GAAP, adjusted to reflect the inclusion of acceptances, provisions for contingent liabilities and commitments,
the fair value of financial guarantees and the grossing-up of certain repurchase agreements offset under UK GAAP, together with
the effect of adjustments made to net income and shareholders’ funds, were £488 billion (2002 – £431 billion).