RBS 2003 Annual Report Download - page 158
Download and view the complete annual report
Please find page 158 of the 2003 RBS annual report below. You can navigate through the pages in the report by either clicking on the pages listed below, or by using the keyword search tool below to find specific information within the annual report.-
 1
1 -
2
-
3
-
4
-
5
-
6
-
7
-
8
-
9
-
10
-
11
-
12
-
13
-
14
-
15
-
16
-
17
-
18
-
19
-
20
-
21
-
22
-
23
-
24
-
25
-
26
-
27
-
28
-
29
-
30
-
31
-
32
-
33
-
34
-
35
-
36
-
37
-
38
-
39
-
40
-
41
-
42
-
43
-
44
-
45
-
46
-
47
-
48
-
49
-
50
-
51
-
52
-
53
-
54
-
55
-
56
-
57
-
58
-
59
-
60
-
61
-
62
-
63
-
64
-
65
-
66
-
67
-
68
-
69
-
70
-
71
-
72
-
73
-
74
-
75
-
76
-
77
-
78
-
79
-
80
-
81
-
82
-
83
-
84
-
85
-
86
-
87
-
88
-
89
-
90
-
91
-
92
-
93
-
94
-
95
-
96
-
97
-
98
-
99
-
100
-
101
-
102
-
103
-
104
-
105
-
106
-
107
-
108
-
109
-
110
-
111
-
112
-
113
-
114
-
115
-
116
-
117
-
118
-
119
-
120
-
121
-
122
-
123
-
124
-
125
-
126
-
127
-
128
-
129
-
130
-
131
-
132
-
133
-
134
-
135
-
136
-
137
-
138
-
139
-
140
-
141
-
142
-
143
-
144
-
145
-
146
-
147
-
 148
148 -
 149
149 -
 150
150 -
 151
151 -
 152
152 -
 153
153 -
 154
154 -
 155
155 -
 156
156 -
 157
157 -
 158
158 -
 159
159 -
 160
160 -
 161
161 -
 162
162 -
 163
163 -
 164
164 -
 165
165 -
 166
166 -
 167
167 -
 168
168 -
169
-
170
-
171
-
172
-
173
-
174
-
175
-
176
-
177
-
178
-
179
-
180
-
181
-
182
-
183
-
184
-
185
-
186
-
187
-
188
-
189
-
190
-
191
-
192
-
193
-
194
-
195
-
196
-
197
-
198
-
199
-
200
-
201
-
202
-
203
-
204
-
205
-
206
-
207
-
208
-
209
-
210
-
211
-
212
-
213
-
214
-
215
-
216
-
217
-
218
-
219
-
220
-
221
-
222
-
223
-
224
-
225
-
226
-
227
-
228
-
229
-
230
 |
 |

156
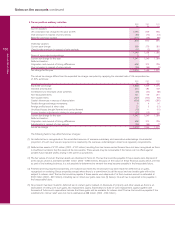
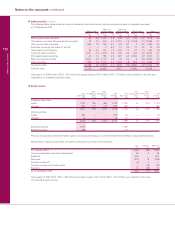
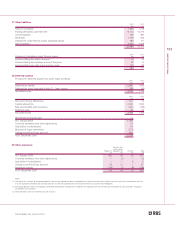
14 Debt securities (continued)
The following table categorises the Group’s investment debt securities by maturity and yield (based on weighted averages)
at 31 December 2003:
After 1 but After 5 but
Within 1 year within 5 years within 10 years After 10 years Total
Amount Yield Amount Yield Amount Yield Amount Yield Amount Yield
£m % £m % £m % £m % £m %
British government securities 68 5.5 1,107 4.8 218 5.3 123 5.2 1,516 4.9
US treasury and other US government securities 75 2.0 533 1.7 1,219 1.6 9,128 3.3 10,955 3.1
Other government securities 695 3.3 766 5.1 24 6.2 2 5.6 1,487 4.3
Securities issued by the states of the US — — 2 5.2 10 3.0 11 4.0 23 3.6
Other public sector bodies 36 5.1 142 1.2 165 1.7 57 1.4 400 1.8
Corporate debt securities 2,477 2.3 3,318 2.8 345 4.4 193 3.2 6,333 2.7
Mortgage-backed securities 42 1.2 185 4.5 481 4.2 4,353 2.9 5,061 3.1
Bank and building society 8,543 3.0 3,100 2.8 42 5.2 5 4.6 11,690 2.9
Other securities 850 3.4 1,376 4.3 1,035 1.8 808 2.4 4,069 3.1
Total book value 12,786 2.9 10,529 3.3 3,539 2.6 14,680 3.2 41,534 3.1
Total fair value 12,756 10,456 3,477 14,666 41,355
Gross gains of £158 million (2002 – £70 million) and gross losses of £47 million (2002 – £7 million) were realised on the sale and
redemption of investment debt securities.
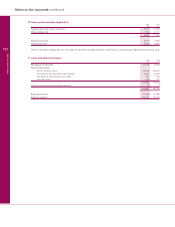
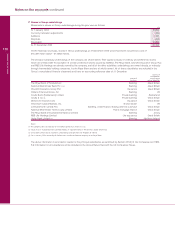
15 Equity shares
Gross Gross Gross Gross
2003 unrecognised unrecognised 2003 2002 unrecognised unrecognised 2002
Book value gains losses Valuation Book value gains losses Valuation
£m £m £m £m £m £m £m £m
Investment securities:
Listed 1,157 350 (88) 1,419 1,097 43 (127) 1,013
Unlisted 664 174 (19) 819 686 — — 686
1,821 524 (107) 2,238 1,783 43 (127) 1,699
Other securities:
Listed 465 — — 465 52——52
Unlisted 14 — — 14 51——51
2,300 524 (107) 2,717 1,886 43 (127) 1,802
Banking business 1,872 1,849
Trading business 428 37
The cost of securities carried at market value is not disclosed because it cannot be determined without unreasonable expense.
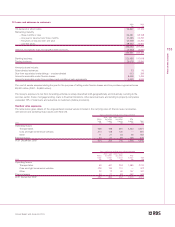
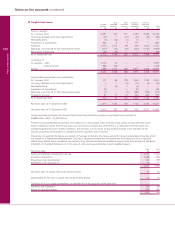
Movements in equity shares which are held as investment securities were as follows:
Cost Provisions Book value
£m £m £m
At 1 January 2003 1,864 (81) 1,783
Currency translation and other adjustments 24 4 28
Additions 300 — 300
Disposals (314) 16 (298)
Amounts written off (4) 4 —
Provisions made net of write backs — (14) (14)
Transfers 70 (48) 22
At 31 December 2003 1,940 (119) 1,821
Gross gains of £68 million (2002 – £52 million) and gross losses of £7 million (2002 – £30 million) were realised on the sale
of investment equity shares.
Notes on the accounts continued
Notes on the accounts