RBS 2003 Annual Report Download - page 150
Download and view the complete annual report
Please find page 150 of the 2003 RBS annual report below. You can navigate through the pages in the report by either clicking on the pages listed below, or by using the keyword search tool below to find specific information within the annual report.-
 1
1 -
2
-
3
-
4
-
5
-
6
-
7
-
8
-
9
-
10
-
11
-
12
-
13
-
14
-
15
-
16
-
17
-
18
-
19
-
20
-
21
-
22
-
23
-
24
-
25
-
26
-
27
-
28
-
29
-
30
-
31
-
32
-
33
-
34
-
35
-
36
-
37
-
38
-
39
-
40
-
41
-
42
-
43
-
44
-
45
-
46
-
47
-
48
-
49
-
50
-
51
-
52
-
53
-
54
-
55
-
56
-
57
-
58
-
59
-
60
-
61
-
62
-
63
-
64
-
65
-
66
-
67
-
68
-
69
-
70
-
71
-
72
-
73
-
74
-
75
-
76
-
77
-
78
-
79
-
80
-
81
-
82
-
83
-
84
-
85
-
86
-
87
-
88
-
89
-
90
-
91
-
92
-
93
-
94
-
95
-
96
-
97
-
98
-
99
-
100
-
101
-
102
-
103
-
104
-
105
-
106
-
107
-
108
-
109
-
110
-
111
-
112
-
113
-
114
-
115
-
116
-
117
-
118
-
119
-
120
-
121
-
122
-
123
-
124
-
125
-
126
-
127
-
128
-
129
-
130
-
131
-
132
-
133
-
134
-
135
-
136
-
137
-
138
-
139
-
 140
140 -
 141
141 -
 142
142 -
 143
143 -
 144
144 -
 145
145 -
 146
146 -
 147
147 -
 148
148 -
 149
149 -
 150
150 -
 151
151 -
 152
152 -
 153
153 -
 154
154 -
 155
155 -
 156
156 -
 157
157 -
 158
158 -
 159
159 -
 160
160 -
161
-
162
-
163
-
164
-
165
-
166
-
167
-
168
-
169
-
170
-
171
-
172
-
173
-
174
-
175
-
176
-
177
-
178
-
179
-
180
-
181
-
182
-
183
-
184
-
185
-
186
-
187
-
188
-
189
-
190
-
191
-
192
-
193
-
194
-
195
-
196
-
197
-
198
-
199
-
200
-
201
-
202
-
203
-
204
-
205
-
206
-
207
-
208
-
209
-
210
-
211
-
212
-
213
-
214
-
215
-
216
-
217
-
218
-
219
-
220
-
221
-
222
-
223
-
224
-
225
-
226
-
227
-
228
-
229
-
230
 |
 |
148
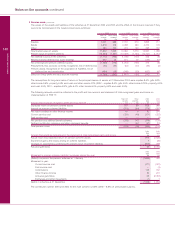
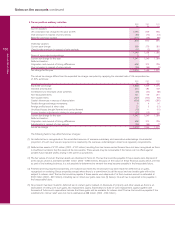
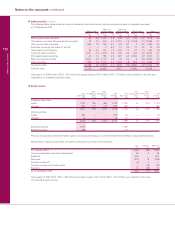
3 Pension costs (continued)
The values of the assets and liabilities of the schemes at 31 December 2003 and 2002 and the effect on the Group’s reserves if they
were to be incorporated in the balance sheet were as follows:
2003 2002 2001
Main UK Other Group Main UK Other Group Main UK Other Group
scheme schemes scheme schemes schemes schemes
£m £m £m £m £m £m
Equities 7,621 686 7,161 610 7,899 717
Bonds 3,818 276 3,298 260 4,203 176
Other 383 103 223 140 465 167
Total market value of assets 11,822 1,065 10,682 1,010 12,567 1,060
Present value of scheme liabilities (13,594) (1,261) (12,418) (1,130) (12,121) (1,014)
Net (deficit)/ surplus in the schemes (1,772) (196) (1,736) (120) 446 46
Related notional deferred tax asset / (liability) 532 22 521 20 (133) (10)
Net unrecognised pension (deficit)/ surplus (1,240) (174) (1,215) (100) 313 36
Prepayments less accruals currently recognised, net of deferred tax (25) (33) (52) (27) (53) (5)
Pension assets recognised on the acquisition of NatWest, net of
deferred tax and amortisation (494) (35) (548) (39) (602) (42)
Effect on Group profit and loss account reserves (1,759) (242) (1,815) (166) (342) (11)
The assumptions for long-term rates of return on the principal classes of assets at 31 December 2003 were equities 8.4%, gilts 4.8%,
other bonds 5.6%, property 6.6% and cash and other assets 4.9% (2002 – equities 8.4%, gilts 4.5%, other bonds 5.75%, property 6.5%
and cash 4.5%; 2001 – equities 8.4%, gilts 5.0%, other bonds 6.0%, property 6.8% and cash 4.5%).
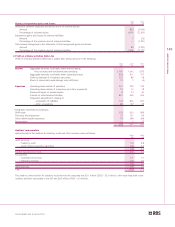
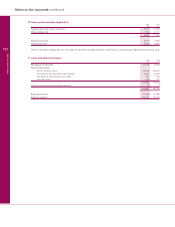
The following amounts would be reflected in the profit and loss account and statement of total recognised gains and losses on
implementation of FRS 17:
Main UK Other 2003 2002
scheme schemes Total Total
Amount that would be charged to profit and loss account £m £m £m £m
Expected return on pension scheme assets 757 69 826 988
Interest on pension scheme liabilities (710) (64) (774) (787)
Net return credited to other finance income 47 5 52 201
Current service cost (325) (46) (371) (322)
Past service cost ———(3)
Net pension cost defined benefit schemes (278) (41) (319) (124)
Defined contribution schemes and other retirement benefits — (37) (37) (19)
Total pension costs (278) (78) (356) (143)
2003 2002
Total Total
Amount that would be recognised in the statement of total recognised gains and losses £m £m
Actual return less expected return on pension scheme assets 872 (2,645)
Experience gains and losses arising on scheme liabilities 7 (25)
Changes in assumptions underlying the present value of scheme liabilities (810) 278
Actuarial gain/(loss) 69 (2,392)
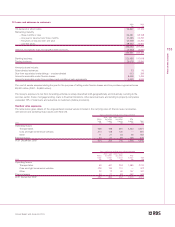
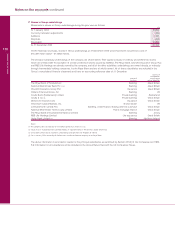
2003 2002
Total Total
Movement in pension scheme (deficits)/ surpluses during the year £m £m
(Deficit)/ surplus in the pension schemes at 1 January (1,856) 492
Movement in year:
Current service cost (371) (322)
Past service cost — (3)
Contributions 139 167
Other finance income 52 201
Actuarial gain/(loss) 69 (2,392)
Exchange and other movements (1) 1
Deficit in schemes at 31 December (1,968) (1,856)
The contribution rate for 2003 and 2004 for the main scheme is 6.8% (2002 – 6.8%) of pensionable salaries.
Notes on the accounts continued
Notes on the accounts