RBS 2003 Annual Report Download - page 96
Download and view the complete annual report
Please find page 96 of the 2003 RBS annual report below. You can navigate through the pages in the report by either clicking on the pages listed below, or by using the keyword search tool below to find specific information within the annual report.-
 1
1 -
2
-
3
-
4
-
5
-
6
-
7
-
8
-
9
-
10
-
11
-
12
-
13
-
14
-
15
-
16
-
17
-
18
-
19
-
20
-
21
-
22
-
23
-
24
-
25
-
26
-
27
-
28
-
29
-
30
-
31
-
32
-
33
-
34
-
35
-
36
-
37
-
38
-
39
-
40
-
41
-
42
-
43
-
44
-
45
-
46
-
47
-
48
-
49
-
50
-
51
-
52
-
53
-
54
-
55
-
56
-
57
-
58
-
59
-
60
-
61
-
62
-
63
-
64
-
65
-
66
-
67
-
68
-
69
-
70
-
71
-
72
-
73
-
74
-
75
-
76
-
77
-
78
-
79
-
80
-
81
-
82
-
83
-
84
-
85
-
 86
86 -
 87
87 -
 88
88 -
 89
89 -
 90
90 -
 91
91 -
 92
92 -
 93
93 -
 94
94 -
 95
95 -
 96
96 -
 97
97 -
 98
98 -
 99
99 -
 100
100 -
 101
101 -
 102
102 -
 103
103 -
 104
104 -
 105
105 -
 106
106 -
107
-
108
-
109
-
110
-
111
-
112
-
113
-
114
-
115
-
116
-
117
-
118
-
119
-
120
-
121
-
122
-
123
-
124
-
125
-
126
-
127
-
128
-
129
-
130
-
131
-
132
-
133
-
134
-
135
-
136
-
137
-
138
-
139
-
140
-
141
-
142
-
143
-
144
-
145
-
146
-
147
-
148
-
149
-
150
-
151
-
152
-
153
-
154
-
155
-
156
-
157
-
158
-
159
-
160
-
161
-
162
-
163
-
164
-
165
-
166
-
167
-
168
-
169
-
170
-
171
-
172
-
173
-
174
-
175
-
176
-
177
-
178
-
179
-
180
-
181
-
182
-
183
-
184
-
185
-
186
-
187
-
188
-
189
-
190
-
191
-
192
-
193
-
194
-
195
-
196
-
197
-
198
-
199
-
200
-
201
-
202
-
203
-
204
-
205
-
206
-
207
-
208
-
209
-
210
-
211
-
212
-
213
-
214
-
215
-
216
-
217
-
218
-
219
-
220
-
221
-
222
-
223
-
224
-
225
-
226
-
227
-
228
-
229
-
230
 |
 |
94
Operating and financial review continued
Operating and financial review
Credit risk (continued)
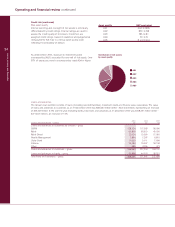
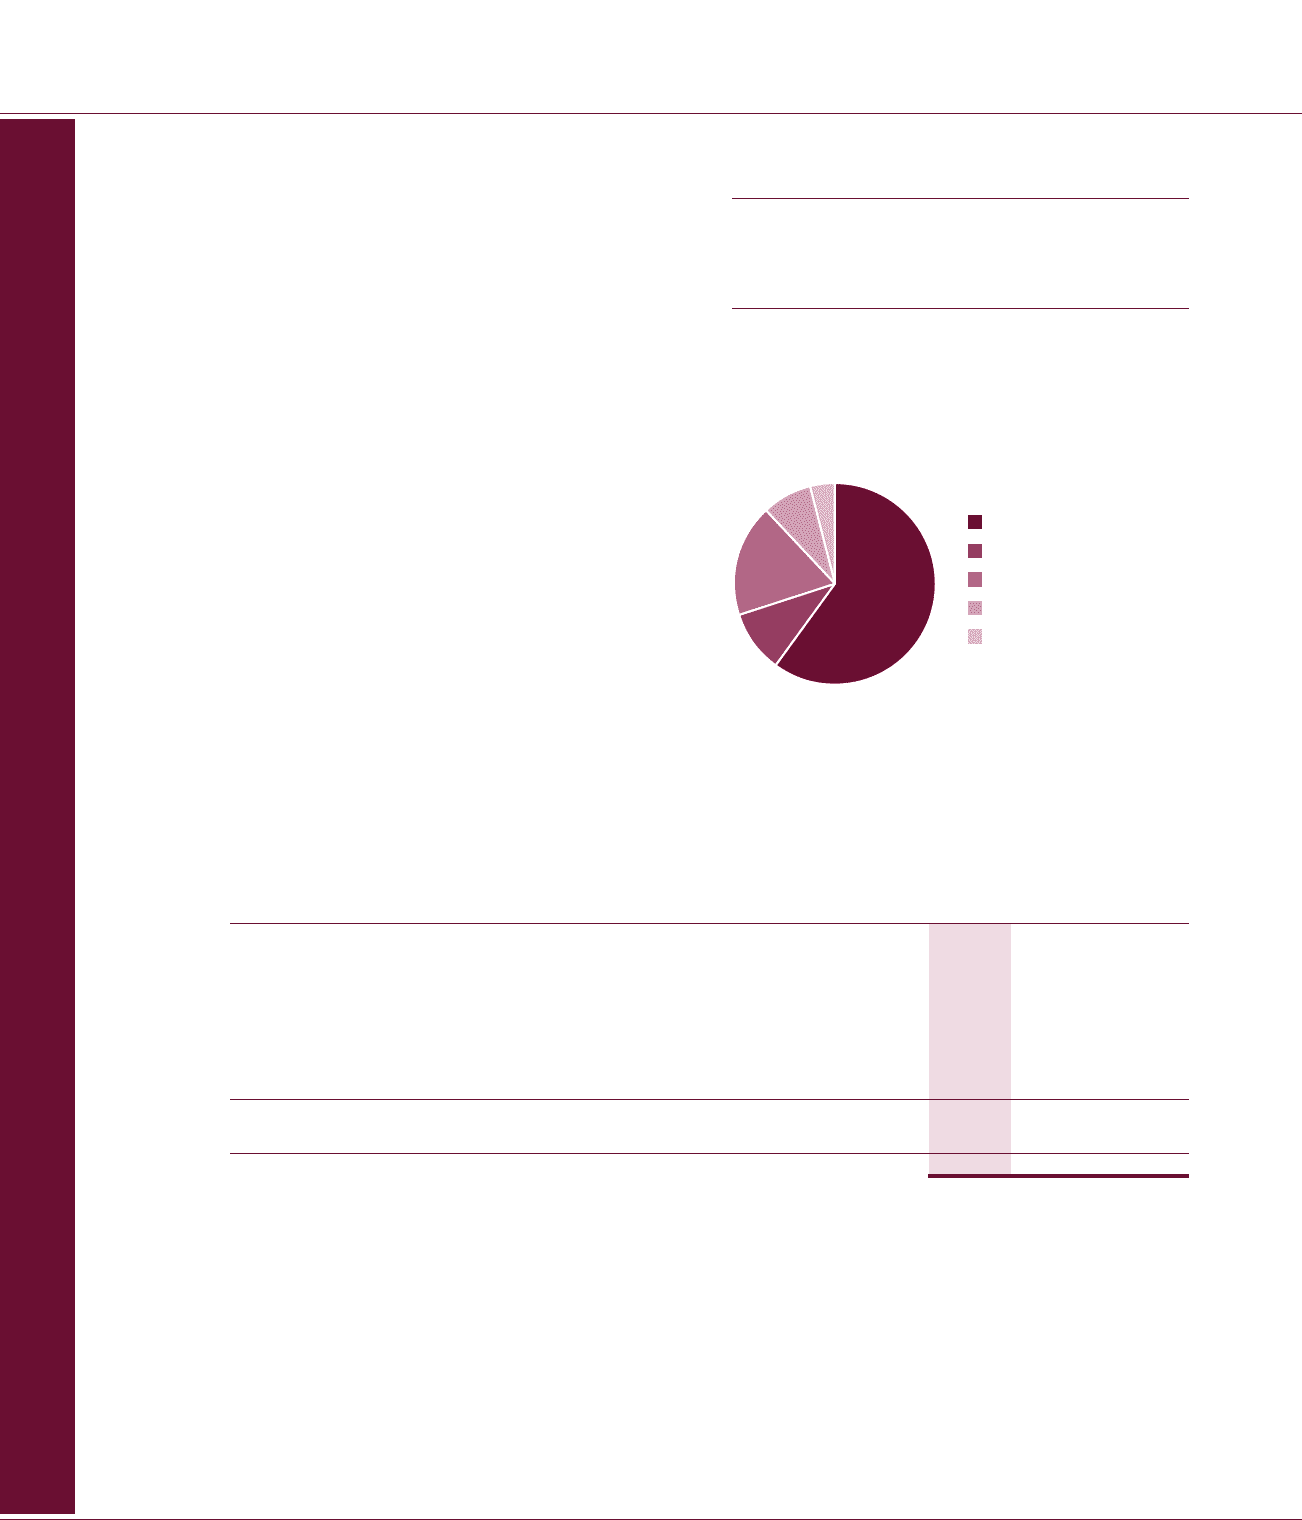
Risk asset quality
Internal reporting and oversight of risk assets is principally
differentiated by credit ratings. Internal ratings are used to
assess the credit quality of borrowers. Customers are
assigned credit ratings, based on statistical and judgemental
rating systems that map to a Group asset quality scale
reflecting the probability of default.
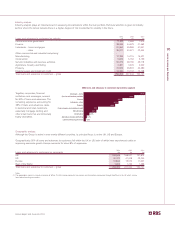
As at December 2003, exposure to investment grade
counterparties (AQ1) accounted for over half of risk assets. Over
97% of exposures were to counterparties rated AQ4 or higher.
Asset quality S&P equivalent
AQ1 AAA to BBB-
AQ2 BB+ to BB
AQ3 BB- to B+
AQ4 B+ to B
AQ5 B and below
AQ1
AQ2
AQ3
AQ4
AQ5
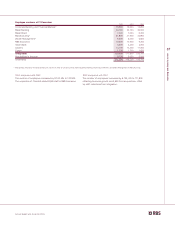
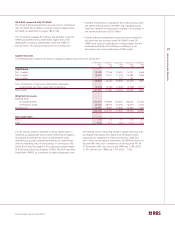
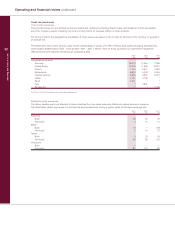
2003 2002 2001
Loans and advances – gross £m £m £m
Loans and advances to customers by division – gross
CBFM 128,124 117,365 95,096
Retail 61,809 55,619 49,026
Retail Direct 22,024 19,350 17,081
Wealth Management 7,894 7,267 6,815
Ulster Bank 11,633 9,111 7,608
Citizens 24,384 19,457 18,138
Other 585 (925) 373
Loans and advances to customers – gross 256,453 227,244 194,137
Loans and advances to banks – gross 51,898 44,303 38,521
Total loans and advances – gross 308,351 271,547 232,658
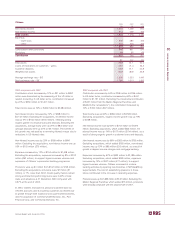
Loans and advances
The Group’s loan portfolio consists of loans (including overdraft facilities), instalment credit and finance lease receivables. The value
of loans and advances to customers as at 31 December 2003 was £256,453 million (2002 – £227,244 million), representing an increase
of £29,209 million (13%) over the year. Including banks, total loans and advances at 31 December 2003 was £308,351 million (2002 –
£271,547 million), an increase of 14%.
Distribution of risk assets
by asset quality