RBS 2003 Annual Report Download - page 107
Download and view the complete annual report
Please find page 107 of the 2003 RBS annual report below. You can navigate through the pages in the report by either clicking on the pages listed below, or by using the keyword search tool below to find specific information within the annual report.-
 1
1 -
2
-
3
-
4
-
5
-
6
-
7
-
8
-
9
-
10
-
11
-
12
-
13
-
14
-
15
-
16
-
17
-
18
-
19
-
20
-
21
-
22
-
23
-
24
-
25
-
26
-
27
-
28
-
29
-
30
-
31
-
32
-
33
-
34
-
35
-
36
-
37
-
38
-
39
-
40
-
41
-
42
-
43
-
44
-
45
-
46
-
47
-
48
-
49
-
50
-
51
-
52
-
53
-
54
-
55
-
56
-
57
-
58
-
59
-
60
-
61
-
62
-
63
-
64
-
65
-
66
-
67
-
68
-
69
-
70
-
71
-
72
-
73
-
74
-
75
-
76
-
77
-
78
-
79
-
80
-
81
-
82
-
83
-
84
-
85
-
86
-
87
-
88
-
89
-
90
-
91
-
92
-
93
-
94
-
95
-
96
-
 97
97 -
 98
98 -
 99
99 -
 100
100 -
 101
101 -
 102
102 -
 103
103 -
 104
104 -
 105
105 -
 106
106 -
 107
107 -
 108
108 -
 109
109 -
 110
110 -
 111
111 -
 112
112 -
 113
113 -
 114
114 -
 115
115 -
 116
116 -
 117
117 -
118
-
119
-
120
-
121
-
122
-
123
-
124
-
125
-
126
-
127
-
128
-
129
-
130
-
131
-
132
-
133
-
134
-
135
-
136
-
137
-
138
-
139
-
140
-
141
-
142
-
143
-
144
-
145
-
146
-
147
-
148
-
149
-
150
-
151
-
152
-
153
-
154
-
155
-
156
-
157
-
158
-
159
-
160
-
161
-
162
-
163
-
164
-
165
-
166
-
167
-
168
-
169
-
170
-
171
-
172
-
173
-
174
-
175
-
176
-
177
-
178
-
179
-
180
-
181
-
182
-
183
-
184
-
185
-
186
-
187
-
188
-
189
-
190
-
191
-
192
-
193
-
194
-
195
-
196
-
197
-
198
-
199
-
200
-
201
-
202
-
203
-
204
-
205
-
206
-
207
-
208
-
209
-
210
-
211
-
212
-
213
-
214
-
215
-
216
-
217
-
218
-
219
-
220
-
221
-
222
-
223
-
224
-
225
-
226
-
227
-
228
-
229
-
230
 |
 |
105
Annual Report and Accounts 2003
Operating and financial review
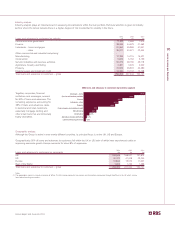
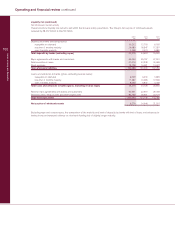
The VaR for the Group’s trading portfolios segregated by type of market risk exposure is presented in the tables below.
Period
end Maximum Minimum Average (1)
Trading VaR £m £m £m £m
2003
Interest rate 27.4 14.5 5.7 9.4
Currency 0.8 2.5 0.7 1.3
Equity 0.4 1.4 0.2 0.5
Diversification effects (1.2)
Total 7.4 14.2 5.6 9.4
2002
Interest rate 28.4 11.6 6.0 9.0
Currency 1.2 2.5 0.4 1.2
Equity 0.6 1.0 0.2 0.5
Diversification effects (1.8)
Total 8.4 11.8 5.6 9.1
Notes:
(1) Calculated as the arithmetic average of daily VaR figures.
(2) Includes credit spreads.
Trading
The principal focus of the Group’s trading activities is client
facilitation - providing products to the Group’s client base at
competitive prices. The Group also undertakes: market making
– quoting firm bid (buy) and offer (sell) prices with the intention
of profiting from the spread between the quotes; arbitrage –
entering into offsetting positions in different but closely related
markets in order to profit from market imperfections; and
proprietary activity – taking positions in financial instruments as
principal in order to take advantage of anticipated market
conditions. The main risk factors are interest rates, credit
spreads and foreign exchange.
Financial instruments held in the Group’s trading portfolios
include, but are not limited to, debt securities, loans, deposits,
securities sale and repurchase agreements and derivative
financial instruments (futures, forwards, swaps and options).