RBS 2003 Annual Report Download - page 85
Download and view the complete annual report
Please find page 85 of the 2003 RBS annual report below. You can navigate through the pages in the report by either clicking on the pages listed below, or by using the keyword search tool below to find specific information within the annual report.-
 1
1 -
2
-
3
-
4
-
5
-
6
-
7
-
8
-
9
-
10
-
11
-
12
-
13
-
14
-
15
-
16
-
17
-
18
-
19
-
20
-
21
-
22
-
23
-
24
-
25
-
26
-
27
-
28
-
29
-
30
-
31
-
32
-
33
-
34
-
35
-
36
-
37
-
38
-
39
-
40
-
41
-
42
-
43
-
44
-
45
-
46
-
47
-
48
-
49
-
50
-
51
-
52
-
53
-
54
-
55
-
56
-
57
-
58
-
59
-
60
-
61
-
62
-
63
-
64
-
65
-
66
-
67
-
68
-
69
-
70
-
71
-
72
-
73
-
74
-
 75
75 -
 76
76 -
 77
77 -
 78
78 -
 79
79 -
 80
80 -
 81
81 -
 82
82 -
 83
83 -
 84
84 -
 85
85 -
 86
86 -
 87
87 -
 88
88 -
 89
89 -
 90
90 -
 91
91 -
 92
92 -
 93
93 -
 94
94 -
 95
95 -
96
-
97
-
98
-
99
-
100
-
101
-
102
-
103
-
104
-
105
-
106
-
107
-
108
-
109
-
110
-
111
-
112
-
113
-
114
-
115
-
116
-
117
-
118
-
119
-
120
-
121
-
122
-
123
-
124
-
125
-
126
-
127
-
128
-
129
-
130
-
131
-
132
-
133
-
134
-
135
-
136
-
137
-
138
-
139
-
140
-
141
-
142
-
143
-
144
-
145
-
146
-
147
-
148
-
149
-
150
-
151
-
152
-
153
-
154
-
155
-
156
-
157
-
158
-
159
-
160
-
161
-
162
-
163
-
164
-
165
-
166
-
167
-
168
-
169
-
170
-
171
-
172
-
173
-
174
-
175
-
176
-
177
-
178
-
179
-
180
-
181
-
182
-
183
-
184
-
185
-
186
-
187
-
188
-
189
-
190
-
191
-
192
-
193
-
194
-
195
-
196
-
197
-
198
-
199
-
200
-
201
-
202
-
203
-
204
-
205
-
206
-
207
-
208
-
209
-
210
-
211
-
212
-
213
-
214
-
215
-
216
-
217
-
218
-
219
-
220
-
221
-
222
-
223
-
224
-
225
-
226
-
227
-
228
-
229
-
230
 |
 |
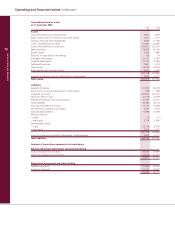
83
Operating and financial review
Annual Report and Accounts 2003
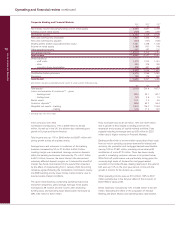
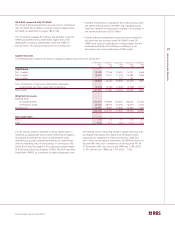
RBS Insurance (formerly Direct Line)
2003 2002 2001
£m £m £m
Earned premiums 3,565 2,383 1,804
Reinsurers’ share (504) (489) (429)
Insurance premium income 3,061 1,894 1,375
Net fees and commissions (99) 65 26
Other income 283 180 142
Total income 3,245 2,139 1,543
Expenses
– staff costs 241 178 152
– other 341 256 182
582 434 334
Gross claims 2,644 1,693 1,263
Reinsurers’ share (449) (343) (315)
Net claims 2,195 1,350 948
Contribution 468 355 261
In-force policies (000’s)
– Motor: UK 8,086 4,668 4,017
– Motor: International 1,541 1,224 601
– Home: UK 5,154 1,587 1,360
Combined operating ratio – UK (%) 91.6 89.4 88.0
Gross insurance reserves – total (£m) 6,582 3,002 2,370
2003 compared with 2002
Contribution increased by 32% or £113 million to £468 million.
Excluding Churchill, contribution increased by 26% or £92 million.
Total income was up 52% or £1,106 million to £3,245 million.
Excluding Churchill, total income grew by 25% or £525 million.
After reinsurance, insurance premium income was up 62% or
£1,167 million to £3,061 million. Excluding Churchill, insurance
premium income (net of reinsurance) grew by 26% or £487
million. The number of UK in-force motor insurance policies
increased by 3.4 million of which 3.1 million was from Churchill,
while the number of UK in-force home insurance policies
increased by 3.6 million including 3.4 million from Churchill.
The number of international in-force motor policies increased
by 317,000 during the year.
Other income net of commissions payable was down from
£245 million to £184 million. Excluding Churchill, which
included £148 million commissions payable to brokers and
intermediaries, other income was up 16% or £38 million due to
higher investment income, embedded value profits and share
of associates profits.
Expenses increased by 34% or £148 million to £582 million.
Excluding Churchill, expenses increased by 9% or £40 million.
Staff numbers, excluding Churchill, increased by 4% (400) to
support growth in business volumes, particularly in the
partnership business.
Net claims, after reinsurance, increased by 63% or £845 million
to £2,195 million. Excluding Churchill, net claims increased by
29% or £393 million.
UK combined operating ratio was 91.6%. Excluding Churchill,
the UK ratio improved from 89.4% to 89.2%.
2002 compared with 2001
Contribution increased by 36% or £94 million to £355 million.
Total income was up 39% or £596 million to £2,139 million.
Excluding acquisitions, which added £73 million, total income
was up 34% or £523 million.
After reinsurance, insurance premium income was up 38% or
£519 million to £1,894 million, reflecting strong growth in
customer numbers. The leading position in the UK direct motor
insurance market was maintained with motor insurance policies
increasing 16%, or 651,000 to 4.67 million. The number of UK
in-force home insurance policies increased by 17% or 227,000
to 1.59 million. The number of international in-force motor
policies more than doubled to 1.22 million, including 280,000
from acquisitions.
Other income increased by 46% or £77 million to £245 million.
Higher investment income and profit commissions contributed
to this increase.
Expenses increased by 30% or £100 million to £434 million.
Excluding acquisitions, which added £35 million, expenses
were up by 20% or £65 million reflecting business expansion.
Net claims, after reinsurance, increased by 42% or £402 million
to £1,350 million reflecting increased volumes.