RBS 2003 Annual Report Download - page 166
Download and view the complete annual report
Please find page 166 of the 2003 RBS annual report below. You can navigate through the pages in the report by either clicking on the pages listed below, or by using the keyword search tool below to find specific information within the annual report.-
 1
1 -
2
-
3
-
4
-
5
-
6
-
7
-
8
-
9
-
10
-
11
-
12
-
13
-
14
-
15
-
16
-
17
-
18
-
19
-
20
-
21
-
22
-
23
-
24
-
25
-
26
-
27
-
28
-
29
-
30
-
31
-
32
-
33
-
34
-
35
-
36
-
37
-
38
-
39
-
40
-
41
-
42
-
43
-
44
-
45
-
46
-
47
-
48
-
49
-
50
-
51
-
52
-
53
-
54
-
55
-
56
-
57
-
58
-
59
-
60
-
61
-
62
-
63
-
64
-
65
-
66
-
67
-
68
-
69
-
70
-
71
-
72
-
73
-
74
-
75
-
76
-
77
-
78
-
79
-
80
-
81
-
82
-
83
-
84
-
85
-
86
-
87
-
88
-
89
-
90
-
91
-
92
-
93
-
94
-
95
-
96
-
97
-
98
-
99
-
100
-
101
-
102
-
103
-
104
-
105
-
106
-
107
-
108
-
109
-
110
-
111
-
112
-
113
-
114
-
115
-
116
-
117
-
118
-
119
-
120
-
121
-
122
-
123
-
124
-
125
-
126
-
127
-
128
-
129
-
130
-
131
-
132
-
133
-
134
-
135
-
136
-
137
-
138
-
139
-
140
-
141
-
142
-
143
-
144
-
145
-
146
-
147
-
148
-
149
-
150
-
151
-
152
-
153
-
154
-
155
-
 156
156 -
 157
157 -
 158
158 -
 159
159 -
 160
160 -
 161
161 -
 162
162 -
 163
163 -
 164
164 -
 165
165 -
 166
166 -
 167
167 -
 168
168 -
 169
169 -
 170
170 -
 171
171 -
 172
172 -
 173
173 -
 174
174 -
 175
175 -
 176
176 -
177
-
178
-
179
-
180
-
181
-
182
-
183
-
184
-
185
-
186
-
187
-
188
-
189
-
190
-
191
-
192
-
193
-
194
-
195
-
196
-
197
-
198
-
199
-
200
-
201
-
202
-
203
-
204
-
205
-
206
-
207
-
208
-
209
-
210
-
211
-
212
-
213
-
214
-
215
-
216
-
217
-
218
-
219
-
220
-
221
-
222
-
223
-
224
-
225
-
226
-
227
-
228
-
229
-
230
 |
 |

164
Notes on the accounts continued
Notes on the accounts
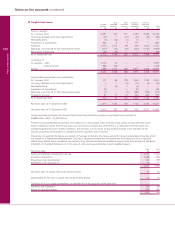
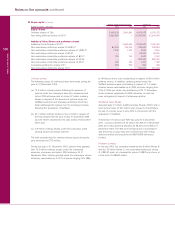
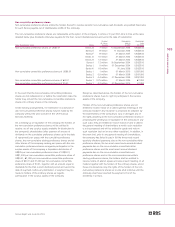
30 Dated loan capital
2003 2002
£m £m
The company
£200 million floating rate (minimum 5.25%) notes 2005 (1,2) 80 120
US$400 million 6.4% subordinated notes 2009 (1) 223 247
US$300 million 6.375% subordinated notes 2011 (1) 166 184
US$750 million 5% subordinated notes 2013 (issued November 2003) (3) 416 —
US$750 million 5% subordinated notes 2014 (1) 417 461
US$250 million 5% subordinated notes 2014 (1) 137 151
US$350 million 4.7% subordinated notes 2018 (issued July 2003) (1,4) 195 —
1,634* 1,163*
The Royal Bank of Scotland plc
£125 million subordinated floating rate notes 2005 (5) 125 125
£150 million 8.375% subordinated notes 2007 149 149
DEM500 million (redesignated 255 million) 5.25% subordinated notes 2008 180 165
300 million 4.875% subordinated notes 2009 211 194
US$150 million floating rate notes 2009 (5) 84 93
£35 million floating rate step-up subordinated notes 2010 35 35
US$350 million floating rate subordinated notes 2012 196 217
130 million floating rate subordinated notes 2012 92 85
US$500 million floating rate subordinated notes 2012 280 310
£150 million 10.5% subordinated bonds 2013 (6) 149 149
1,000 million 6.0% fixed rate subordinated notes 2013 700 644
500 million 6.0% fixed rate subordinated notes 2013 362 334
US$50 million floating rate subordinated notes 2013 28 31
1,000 million floating rate subordinated notes 2013 (issued October 2003; callable October 2008) (7) 705 —
£250 million 9.625% subordinated bonds 2015 248 247
750 million 4.875% subordinated notes 2015 (issued April 2003) (8) 529 —
500 million 4.5% subordinated notes 2016 (issued December 2003; callable January 2011) (9) 351 —
100 million floating rate subordinated notes 2017 70 65
US$125.6 million floating rate subordinated notes 2020 70 78
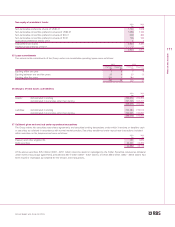
RBSG Capital Corporation
US$250 million 10.125% guaranteed capital notes 2004 (1,6) 140 155
National Westminster Bank Plc
US$500 million 9.375% guaranteed capital notes 2003 (10) —315
£100 million 12.5% subordinated unsecured loan stock 2004 104 108
US$400 million guaranteed floating rate capital notes 2005 223 246
US$1,000 million 7.375% fixed rate subordinated notes 2009 553 611
US$650 million floating rate subordinated step-up notes 2009 (callable October 2004) 366 404
600 million 6.0% subordinated notes 2010 419 386
£300 million 8.125% step-up subordinated notes 2011 (callable December 2006) 303 305
500 million 5.125% subordinated notes 2011 341 309
£300 million 7.875% subordinated notes 2015 309 316
£300 million 6.5% subordinated notes 2021 297 298
Greenwich Capital Holdings, Inc.
US$105 million subordinated loan capital 2004 floating rate notes 59 65
9,312 7,602
Dated loan capital in issue, by remaining maturity is repayable as follows:
– in one year or less 709 355
– in two years or less but over one year 388 772
– in five years or less but over two years 1,337 865
– in more than five years 6,878 5,610
9,312 7,602
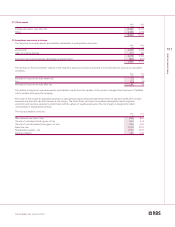
* In addition, the company issued 1.25 million subordinated loan notes of 1,000 each in June 2002, 750,000 subordinated loan notes
of US$1,000 each in December 2002, 850,000 subordinated loan notes of US$1,000 each in May 2003 and 650,000 subordinated
loan notes of US$1,000 each in December 2003 to subsidiaries of the Group. These loan notes are included in the company balance
sheet within loan capital but are reclassified as non-equity minority interests on consolidation (see Note 32).