RBS 2003 Annual Report Download - page 49
Download and view the complete annual report
Please find page 49 of the 2003 RBS annual report below. You can navigate through the pages in the report by either clicking on the pages listed below, or by using the keyword search tool below to find specific information within the annual report.-
 1
1 -
2
-
3
-
4
-
5
-
6
-
7
-
8
-
9
-
10
-
11
-
12
-
13
-
14
-
15
-
16
-
17
-
18
-
19
-
20
-
21
-
22
-
23
-
24
-
25
-
26
-
27
-
28
-
29
-
30
-
31
-
32
-
33
-
34
-
35
-
36
-
37
-
38
-
 39
39 -
 40
40 -
 41
41 -
 42
42 -
 43
43 -
 44
44 -
 45
45 -
 46
46 -
 47
47 -
 48
48 -
 49
49 -
 50
50 -
 51
51 -
 52
52 -
 53
53 -
 54
54 -
 55
55 -
 56
56 -
 57
57 -
 58
58 -
 59
59 -
60
-
61
-
62
-
63
-
64
-
65
-
66
-
67
-
68
-
69
-
70
-
71
-
72
-
73
-
74
-
75
-
76
-
77
-
78
-
79
-
80
-
81
-
82
-
83
-
84
-
85
-
86
-
87
-
88
-
89
-
90
-
91
-
92
-
93
-
94
-
95
-
96
-
97
-
98
-
99
-
100
-
101
-
102
-
103
-
104
-
105
-
106
-
107
-
108
-
109
-
110
-
111
-
112
-
113
-
114
-
115
-
116
-
117
-
118
-
119
-
120
-
121
-
122
-
123
-
124
-
125
-
126
-
127
-
128
-
129
-
130
-
131
-
132
-
133
-
134
-
135
-
136
-
137
-
138
-
139
-
140
-
141
-
142
-
143
-
144
-
145
-
146
-
147
-
148
-
149
-
150
-
151
-
152
-
153
-
154
-
155
-
156
-
157
-
158
-
159
-
160
-
161
-
162
-
163
-
164
-
165
-
166
-
167
-
168
-
169
-
170
-
171
-
172
-
173
-
174
-
175
-
176
-
177
-
178
-
179
-
180
-
181
-
182
-
183
-
184
-
185
-
186
-
187
-
188
-
189
-
190
-
191
-
192
-
193
-
194
-
195
-
196
-
197
-
198
-
199
-
200
-
201
-
202
-
203
-
204
-
205
-
206
-
207
-
208
-
209
-
210
-
211
-
212
-
213
-
214
-
215
-
216
-
217
-
218
-
219
-
220
-
221
-
222
-
223
-
224
-
225
-
226
-
227
-
228
-
229
-
230
 |
 |

2
1
4
5
6
7
3
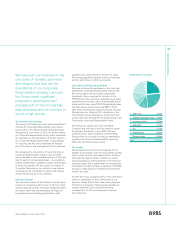
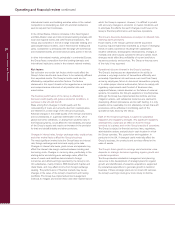
1Staff costs £4.5bn
2Suppliers and other costs £4.9bn
3Insurance claims £2.2bn
4Bad debts £1.5bn
5Tax £1.9bn
6Shareholders £3.4bn
7Retained profit £0.8bn
Total £19.2bn
Distribution of income
Corporate responsibility
Annual Report and Accounts 2003
47
We have built our business on the
principles of honesty, openness
and integrity and they are the
foundations of our Corporate
Responsibility strategy. Last year
the Group made significant
progress in governance and
management of this increasingly
important area and will continue to
give it a high priority.
Governance and reporting
The Group Chief Executive is the designated Board
member for Corporate Responsibility and reports
twice yearly to the Board and the Group Executive
Management Committee. In 2003 the Board ratified
our Corporate Responsibility Policy, which embraces
the principles of the Association of British Insurers.
Our Corporate Responsibility team, is responsible
for ensuring that this policy becomes an integral
part of the day to day management of our business.
We recognise the importance of reporting fully on
Corporate Responsibility matters, and our 2003
report provides a more detailed analysis of the past
year for each of our key stakeholders – our customers,
people, shareholders, suppliers and the communities
in which we operate. We also report on matters of
Corporate Governance, our position in key indices
and what we do to manage the direct and indirect
environmental impact of our activities.
Economic impact
The economic impact of the Group’s activities goes
beyond our financial performance. In 2003 our total
income was £19.2 billion. The table alongside shows
the way in which this was distributed amongst our
key stakeholders including shareholders, staff,
suppliers and Governments in the form of taxes.
This brings significant benefits to the communities
and the economies in which we operate.
International indices and guidelines
We have continued to participate in the most well
established Corporate Responsibility indices. We
have once again met the socially responsible
investment criteria required for inclusion in the
FTSE4Good Index, and been selected as an index
component for the Dow Jones Sustainability World
Index and the Dow Jones STOXX Sustainability Index.
Our Dow Jones overall score was 58% in 2003,
10% above the financial services industry average.
We improved our rating by 9% in Business in the
Community’s annual Business in the Environment
survey, and have participated in the Business in the
Community Corporate Responsibility Index.
The Group has signed up to the UN Global
Compact and was one of the first banks to adopt
the Equator Principles in June 2003. We have
continued to be active members of the FORGE
Group, which is currently focusing on developing
guidance for Corporate Responsibility reporting
within the financial services sector.
Our people
We recognise that our success depends on the
abilities of our people, how we reward them and the
way in which we train and develop them. To attract
and retain the highest calibre of staff, our overall
reward package is among the best in the financial
services sector, with a combination of remuneration,
a final salary pension scheme, a selection of benefits,
access to profit share and sharesave schemes for
most of our staff.
In 2003 the Group awarded staff a 10% profit share
bonus in recognition of their contribution to our
success. Nearly £190 million was shared between
105,000 of our people. Non-financial benefits are
equally important, such as flexible working
arrangements to suit our employees’ personal
circumstances.