RBS 2003 Annual Report Download - page 97
Download and view the complete annual report
Please find page 97 of the 2003 RBS annual report below. You can navigate through the pages in the report by either clicking on the pages listed below, or by using the keyword search tool below to find specific information within the annual report.-
 1
1 -
2
-
3
-
4
-
5
-
6
-
7
-
8
-
9
-
10
-
11
-
12
-
13
-
14
-
15
-
16
-
17
-
18
-
19
-
20
-
21
-
22
-
23
-
24
-
25
-
26
-
27
-
28
-
29
-
30
-
31
-
32
-
33
-
34
-
35
-
36
-
37
-
38
-
39
-
40
-
41
-
42
-
43
-
44
-
45
-
46
-
47
-
48
-
49
-
50
-
51
-
52
-
53
-
54
-
55
-
56
-
57
-
58
-
59
-
60
-
61
-
62
-
63
-
64
-
65
-
66
-
67
-
68
-
69
-
70
-
71
-
72
-
73
-
74
-
75
-
76
-
77
-
78
-
79
-
80
-
81
-
82
-
83
-
84
-
85
-
86
-
 87
87 -
 88
88 -
 89
89 -
 90
90 -
 91
91 -
 92
92 -
 93
93 -
 94
94 -
 95
95 -
 96
96 -
 97
97 -
 98
98 -
 99
99 -
 100
100 -
 101
101 -
 102
102 -
 103
103 -
 104
104 -
 105
105 -
 106
106 -
 107
107 -
108
-
109
-
110
-
111
-
112
-
113
-
114
-
115
-
116
-
117
-
118
-
119
-
120
-
121
-
122
-
123
-
124
-
125
-
126
-
127
-
128
-
129
-
130
-
131
-
132
-
133
-
134
-
135
-
136
-
137
-
138
-
139
-
140
-
141
-
142
-
143
-
144
-
145
-
146
-
147
-
148
-
149
-
150
-
151
-
152
-
153
-
154
-
155
-
156
-
157
-
158
-
159
-
160
-
161
-
162
-
163
-
164
-
165
-
166
-
167
-
168
-
169
-
170
-
171
-
172
-
173
-
174
-
175
-
176
-
177
-
178
-
179
-
180
-
181
-
182
-
183
-
184
-
185
-
186
-
187
-
188
-
189
-
190
-
191
-
192
-
193
-
194
-
195
-
196
-
197
-
198
-
199
-
200
-
201
-
202
-
203
-
204
-
205
-
206
-
207
-
208
-
209
-
210
-
211
-
212
-
213
-
214
-
215
-
216
-
217
-
218
-
219
-
220
-
221
-
222
-
223
-
224
-
225
-
226
-
227
-
228
-
229
-
230
 |
 |
95
Annual Report and Accounts 2003
Operating and financial review
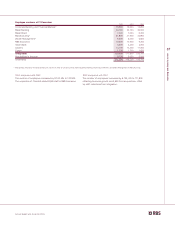
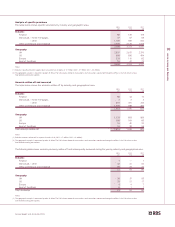
2003 2002 2001
Loans and advances to customers by geography £m £m £m
UK 194,545 168,931 151,814
US 40,373 41,008 29,230
Europe 19,842 15,572 11,627
Rest of the World 1,693 1,733 1,466
Total loans and advances to customers – gross 256,453 227,244 194,137
Notes:
(1) The geographic analysis is based on location of office. The UK includes domestic transactions and transactions conducted through the offices in the UK which service
international banking transactions.
2003 2002 2001
Loans and advances to customers by industry £m £m £m
Central and local government 2,100 2,385 1,419
Finance 38,936 34,079 21,462
Individuals – home mortgages 61,960 49,986 41,641
– other 35,027 30,021 22,403
Other commercial and industrial comprising:
Manufacturing 12,769 14,715 15,427
Construction 5,839 5,152 5,199
Service industries and business activities 50,772 48,155 49,118
Agriculture, forestry and fishing 3,081 3,026 2,940
Property 31,629 26,593 22,380
Finance leases and instalment credit 14,340 13,132 12,148
Total loans and advances to customers – gross 256,453 227,244 194,137
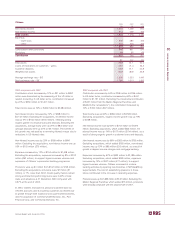
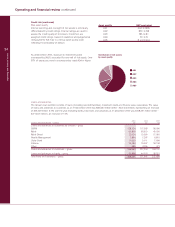
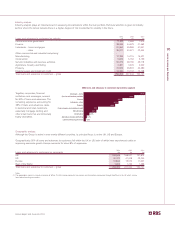
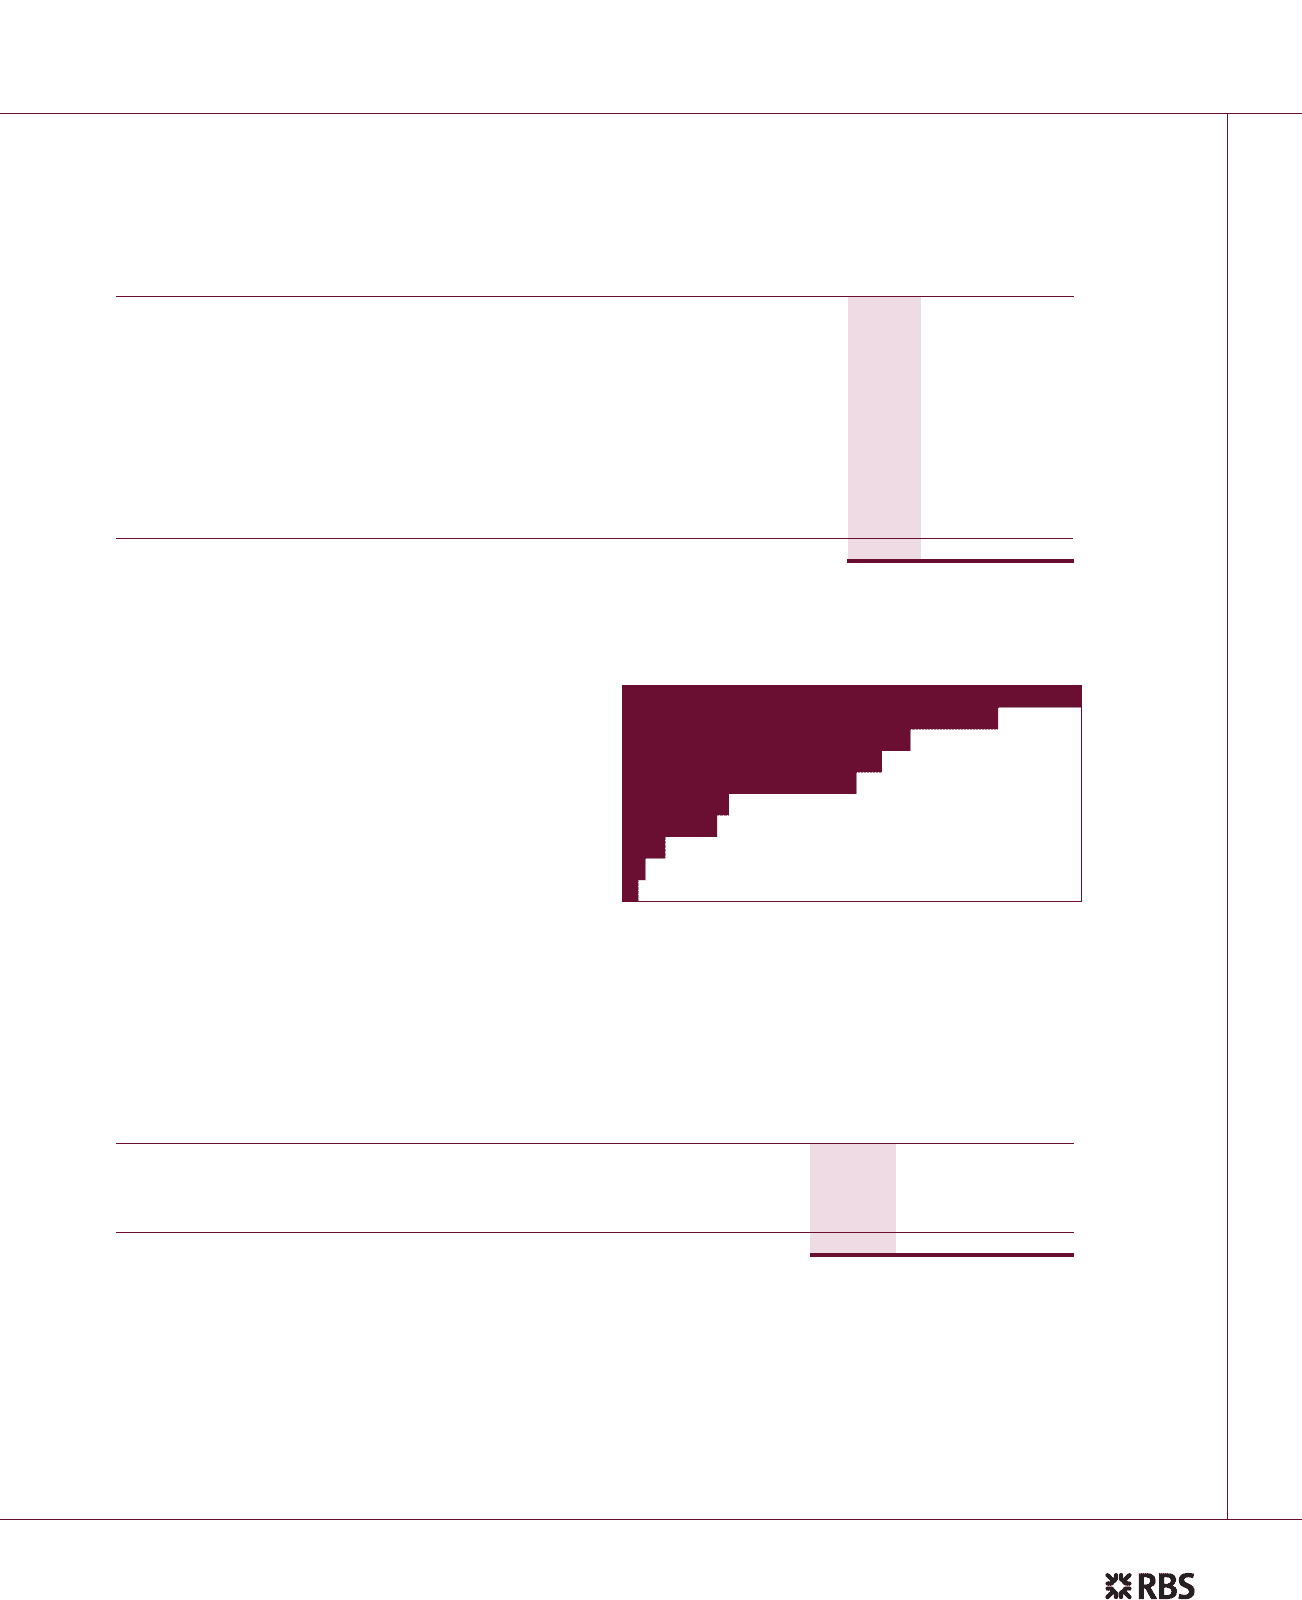
Industry analysis
Industry analysis plays an important part in assessing concentrations within the loan portfolio. Particular attention is given to industry
sectors where the Group believes there is a higher degree of risk or potential for volatility in the future.
Together, corporates, financial
institutions and sovereigns, account
for 62% of loans and advances. The
remaining exposures, accounting for
38% of loans and advances, relate
to personal and retail customers,
especially mortgage lending and
other small loans that are intrinsically
highly diversified.
Geographic analysis
Although the Group is active in over twenty different countries, its principal focus is on the UK, US and Europe.
Geographically, 92% of loans and advances to customers fall within the UK or US, both of which have experienced stable or
improving economic growth. Europe accounts for about 8% of exposures.
24.1%
19.8%
15.2%
13.7%
12.3%
5.6%
5.0%
2.3%
1.2%
0.8%
Individuals – home
Service and business activities
Finance
Individuals – other
Property
Manufacturing
Finance leases and instalment credit
Construction
Agriculture, forestry and fishing
Central and local government
2003 loans and advances to customers by industry segment