RBS 2003 Annual Report Download - page 74
Download and view the complete annual report
Please find page 74 of the 2003 RBS annual report below. You can navigate through the pages in the report by either clicking on the pages listed below, or by using the keyword search tool below to find specific information within the annual report.-
 1
1 -
2
-
3
-
4
-
5
-
6
-
7
-
8
-
9
-
10
-
11
-
12
-
13
-
14
-
15
-
16
-
17
-
18
-
19
-
20
-
21
-
22
-
23
-
24
-
25
-
26
-
27
-
28
-
29
-
30
-
31
-
32
-
33
-
34
-
35
-
36
-
37
-
38
-
39
-
40
-
41
-
42
-
43
-
44
-
45
-
46
-
47
-
48
-
49
-
50
-
51
-
52
-
53
-
54
-
55
-
56
-
57
-
58
-
59
-
60
-
61
-
62
-
63
-
 64
64 -
 65
65 -
 66
66 -
 67
67 -
 68
68 -
 69
69 -
 70
70 -
 71
71 -
 72
72 -
 73
73 -
 74
74 -
 75
75 -
 76
76 -
 77
77 -
 78
78 -
 79
79 -
 80
80 -
 81
81 -
 82
82 -
 83
83 -
 84
84 -
85
-
86
-
87
-
88
-
89
-
90
-
91
-
92
-
93
-
94
-
95
-
96
-
97
-
98
-
99
-
100
-
101
-
102
-
103
-
104
-
105
-
106
-
107
-
108
-
109
-
110
-
111
-
112
-
113
-
114
-
115
-
116
-
117
-
118
-
119
-
120
-
121
-
122
-
123
-
124
-
125
-
126
-
127
-
128
-
129
-
130
-
131
-
132
-
133
-
134
-
135
-
136
-
137
-
138
-
139
-
140
-
141
-
142
-
143
-
144
-
145
-
146
-
147
-
148
-
149
-
150
-
151
-
152
-
153
-
154
-
155
-
156
-
157
-
158
-
159
-
160
-
161
-
162
-
163
-
164
-
165
-
166
-
167
-
168
-
169
-
170
-
171
-
172
-
173
-
174
-
175
-
176
-
177
-
178
-
179
-
180
-
181
-
182
-
183
-
184
-
185
-
186
-
187
-
188
-
189
-
190
-
191
-
192
-
193
-
194
-
195
-
196
-
197
-
198
-
199
-
200
-
201
-
202
-
203
-
204
-
205
-
206
-
207
-
208
-
209
-
210
-
211
-
212
-
213
-
214
-
215
-
216
-
217
-
218
-
219
-
220
-
221
-
222
-
223
-
224
-
225
-
226
-
227
-
228
-
229
-
230
 |
 |
Operating and financial review continued
72
Operating and financial review
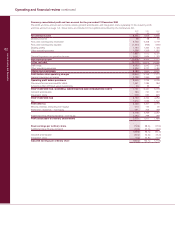
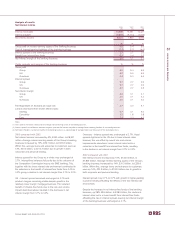
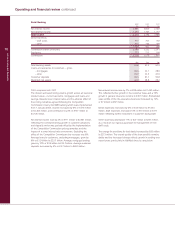
Operating expenses (excluding goodwill amortisation and integration costs)
2003 2002 2001
£m £m £m
Administrative expenses:
Staff costs 4,393 3,942 3,461
Premises and equipment 1,042 879 809
Other administrative 2,035 1,955 1,715
Total administrative expenses 7,470 6,776 5,985
Depreciation of tangible fixed assets 919 893 856
8,389 7,669 6,841
2003 compared with 2002
Operating expenses excluding goodwill amortisation and
integration costs rose by 9% or £720 million to £8,389 million.
This increased expenditure was in support of strong organic
growth and customer service improvements. Excluding
acquisitions, operating expenses were up 7%, £521 million in
support of higher business volumes and 10% income growth.
Staff costs were up £451 million, 11% to £4,393 million
reflecting acquisitions and business growth. The number of
staff increased by 9,100, 8% to 120,900. Acquisitions in the
year added 9,700 staff of which 8,500 related to Churchill.
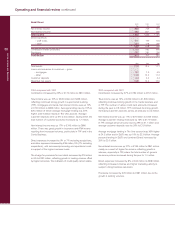
Premises and equipment expenses increased by £163 million,
19% to £1,042 million reflecting the continuing upgrade of the
property portfolio in major UK centres to support the core
business.
The increase in other administrative expenses reflected higher
business volumes and included expenditure in support of
Group wide projects.
Continued income growth coupled with a rigorous approach to
cost management further improved the Group’s cost:income
ratio, to 42.0% from 44.0%. Excluding the effect of acquisitions
the cost:income ratio improved to 42.5%.
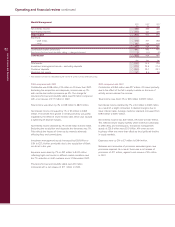
2002 compared with 2001
Operating expenses excluding goodwill amortisation and
integration costs rose by 12% or £828 million to £7,669 million.
This reflected the effect of acquisitions and expenditure to
support strong organic growth and customer service
improvements. Excluding acquisitions, operating expenses
were up 7%, £469 million in support of strong growth in
business volumes.
Staff costs were up £481 million, 14% to £3,942 million reflecting
acquisitions and business growth. The number of staff employed
increased by 6,100, 6% to 111,800. Excluding acquisitions
since 1 January 2001, staff numbers increased by 500.
Premises and equipment expenses increased by £70 million,
9% to £879 million reflecting higher operating lease rentals and
higher utility costs supporting business expansion.
The increase in other administrative expenses reflected higher
marketing expenditure, outsourcing costs and legal and
professional fees.
Strong income growth coupled with tight cost management
resulted in a further improvement in the Group’s cost income
ratio, to 44.0% from 45.3%. Excluding the effect of acquisitions
the cost:income ratio improved to 43.7%.