RBS 2003 Annual Report Download - page 70
Download and view the complete annual report
Please find page 70 of the 2003 RBS annual report below. You can navigate through the pages in the report by either clicking on the pages listed below, or by using the keyword search tool below to find specific information within the annual report.-
 1
1 -
2
-
3
-
4
-
5
-
6
-
7
-
8
-
9
-
10
-
11
-
12
-
13
-
14
-
15
-
16
-
17
-
18
-
19
-
20
-
21
-
22
-
23
-
24
-
25
-
26
-
27
-
28
-
29
-
30
-
31
-
32
-
33
-
34
-
35
-
36
-
37
-
38
-
39
-
40
-
41
-
42
-
43
-
44
-
45
-
46
-
47
-
48
-
49
-
50
-
51
-
52
-
53
-
54
-
55
-
56
-
57
-
58
-
59
-
 60
60 -
 61
61 -
 62
62 -
 63
63 -
 64
64 -
 65
65 -
 66
66 -
 67
67 -
 68
68 -
 69
69 -
 70
70 -
 71
71 -
 72
72 -
 73
73 -
 74
74 -
 75
75 -
 76
76 -
 77
77 -
 78
78 -
 79
79 -
 80
80 -
81
-
82
-
83
-
84
-
85
-
86
-
87
-
88
-
89
-
90
-
91
-
92
-
93
-
94
-
95
-
96
-
97
-
98
-
99
-
100
-
101
-
102
-
103
-
104
-
105
-
106
-
107
-
108
-
109
-
110
-
111
-
112
-
113
-
114
-
115
-
116
-
117
-
118
-
119
-
120
-
121
-
122
-
123
-
124
-
125
-
126
-
127
-
128
-
129
-
130
-
131
-
132
-
133
-
134
-
135
-
136
-
137
-
138
-
139
-
140
-
141
-
142
-
143
-
144
-
145
-
146
-
147
-
148
-
149
-
150
-
151
-
152
-
153
-
154
-
155
-
156
-
157
-
158
-
159
-
160
-
161
-
162
-
163
-
164
-
165
-
166
-
167
-
168
-
169
-
170
-
171
-
172
-
173
-
174
-
175
-
176
-
177
-
178
-
179
-
180
-
181
-
182
-
183
-
184
-
185
-
186
-
187
-
188
-
189
-
190
-
191
-
192
-
193
-
194
-
195
-
196
-
197
-
198
-
199
-
200
-
201
-
202
-
203
-
204
-
205
-
206
-
207
-
208
-
209
-
210
-
211
-
212
-
213
-
214
-
215
-
216
-
217
-
218
-
219
-
220
-
221
-
222
-
223
-
224
-
225
-
226
-
227
-
228
-
229
-
230
 |
 |

Operating and financial review continued
68
Operating and financial review
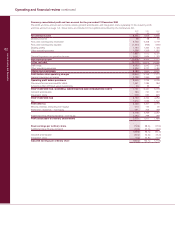
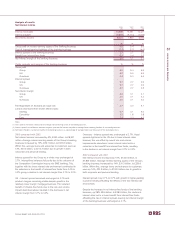
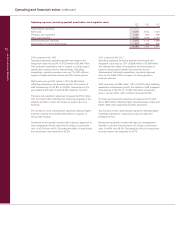
Average balance sheet and related interest
2003 2002
Average Average
balance Interest Rate balance Interest Rate
£m £m % £m £m %
Assets
Treasury and other eligible bills – UK 1,378 48 3.5 910 24 2.6
– Overseas 64 1 1.6 351 6 1.7
Loans and advances to banks – UK 13,724 459 3.3 13,439 532 4.0
– Overseas 9,559 212 2.2 9,811 304 3.1
Loans and advances to customers – UK 168,390 9,519 5.7 154,202 9,141 5.9
– Overseas 44,862 2,240 5.0 35,759 1,963 5.5
Debt securities – UK 23,810 754 3.2 17,950 675 3.8
– Overseas 17,927 765 4.3 18,188 916 5.0
Total interest-earning assets – banking business 279,714 13,998 5.0 250,610 13,561 5.4
– trading business (3) 96,648 78,380
Total interest-earning assets 376,362 328,990
Non-interest-earning assets 67,026 65,898
Total assets 443,388 394,888
Percentage of assets applicable to overseas operations 32.4% 32.0%
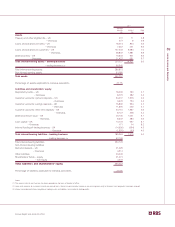
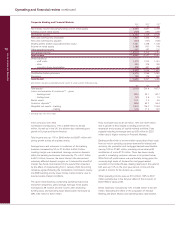
Liabilities and shareholders’ equity
Deposits by banks – UK 28,220 703 2.5 21,090 544 2.6
– Overseas 9,565 218 2.3 9,058 215 2.4
Customer accounts: demand deposits – UK 64,469 1,028 1.6 58,618 1,062 1.8
– Overseas 9,166 70 0.8 8,275 99 1.2
Customer accounts: savings deposits – UK 18,653 503 2.7 16,002 463 2.9
– Overseas 16,310 260 1.6 11,742 229 2.0
Customer accounts: other time deposits – UK 49,880 1,478 3.0 45,902 1,542 3.4
– Overseas 16,642 374 2.2 16,264 462 2.8
Debt securities in issue – UK 29,977 914 3.0 24,154 965 4.0
– Overseas 9,630 119 1.2 8,693 209 2.4
Loan capital – UK 15,342 534 3.5 13,154 640 4.9
– Overseas 154 16 10.4 166 17 10.2
Internal funding of trading business – UK (21,258) (497) 2.3 (20,129) (709) 3.5
– Overseas (1,651) (23) 1.4 (1,301) (26) 2.0
Total interest-bearing liabilities – banking business 245,099 5,697 2.3 211,688 5,712 2.7
– trading business (3) 93,466 75,059
Total interest-bearing liabilities 338,565 286,747
Non-interest-bearing liabilities
Demand deposits – UK 17,589 21,848
– Overseas 7,330 6,401
Other liabilities 51,793 52,600
Shareholders’ funds – equity 24,956 23,553
– non-equity 3,155 3,739
Total liabilities and shareholders’ equity 443,388 394,888
Percentage of liabilities applicable to overseas operations 30.7% 30.4%
Notes:
(1) The analysis into UK and Overseas has been compiled on the basis of location of office.
(2) Loans and advances to customers include non-accrual loans. Interest income includes income on non-accruing loans only to the extent cash payments have been received.
(3) Interest receivable and interest payable on trading assets and liabilities are included in dealing profits.