RBS 2003 Annual Report Download - page 211
Download and view the complete annual report
Please find page 211 of the 2003 RBS annual report below. You can navigate through the pages in the report by either clicking on the pages listed below, or by using the keyword search tool below to find specific information within the annual report.-
 1
1 -
2
-
3
-
4
-
5
-
6
-
7
-
8
-
9
-
10
-
11
-
12
-
13
-
14
-
15
-
16
-
17
-
18
-
19
-
20
-
21
-
22
-
23
-
24
-
25
-
26
-
27
-
28
-
29
-
30
-
31
-
32
-
33
-
34
-
35
-
36
-
37
-
38
-
39
-
40
-
41
-
42
-
43
-
44
-
45
-
46
-
47
-
48
-
49
-
50
-
51
-
52
-
53
-
54
-
55
-
56
-
57
-
58
-
59
-
60
-
61
-
62
-
63
-
64
-
65
-
66
-
67
-
68
-
69
-
70
-
71
-
72
-
73
-
74
-
75
-
76
-
77
-
78
-
79
-
80
-
81
-
82
-
83
-
84
-
85
-
86
-
87
-
88
-
89
-
90
-
91
-
92
-
93
-
94
-
95
-
96
-
97
-
98
-
99
-
100
-
101
-
102
-
103
-
104
-
105
-
106
-
107
-
108
-
109
-
110
-
111
-
112
-
113
-
114
-
115
-
116
-
117
-
118
-
119
-
120
-
121
-
122
-
123
-
124
-
125
-
126
-
127
-
128
-
129
-
130
-
131
-
132
-
133
-
134
-
135
-
136
-
137
-
138
-
139
-
140
-
141
-
142
-
143
-
144
-
145
-
146
-
147
-
148
-
149
-
150
-
151
-
152
-
153
-
154
-
155
-
156
-
157
-
158
-
159
-
160
-
161
-
162
-
163
-
164
-
165
-
166
-
167
-
168
-
169
-
170
-
171
-
172
-
173
-
174
-
175
-
176
-
177
-
178
-
179
-
180
-
181
-
182
-
183
-
184
-
185
-
186
-
187
-
188
-
189
-
190
-
191
-
192
-
193
-
194
-
195
-
196
-
197
-
198
-
199
-
200
-
 201
201 -
 202
202 -
 203
203 -
 204
204 -
 205
205 -
 206
206 -
 207
207 -
 208
208 -
 209
209 -
 210
210 -
 211
211 -
 212
212 -
 213
213 -
 214
214 -
 215
215 -
 216
216 -
 217
217 -
 218
218 -
 219
219 -
 220
220 -
 221
221 -
222
-
223
-
224
-
225
-
226
-
227
-
228
-
229
-
230
 |
 |

209
Annual Report and Accounts 2003
Additional information
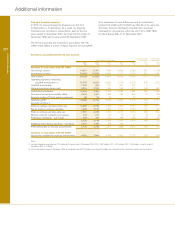
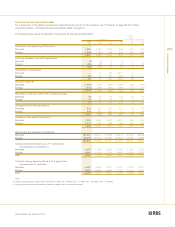
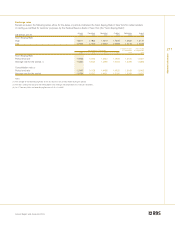
Analysis of deposits – product analysis
The following table shows the distribution of the Group’s deposits by type and geographical area:
2003 2002 2001
£m £m £m
UK
Domestic:
Demand deposits – interest-free 20,567 22,067 21,095
Demand deposits – interest-bearing 78,670 66,118 63,609
Time deposits – savings 13,238 12,180 13,226
Time deposits – other 57,994 59,819 40,360
Overseas residents:
Demand deposits – interest-free 830 908 1,301
Demand deposits – interest-bearing 9,559 8,897 7,286
Time deposits – savings 1,014 1,559 3,210
Time deposits – other 32,531 21,824 21,979
Total UK offices 214,403 193,372 172,066
Overseas
Demand deposits – interest-free 7,937 6,698 6,719
Demand deposits – interest-bearing 7,471 10,148 10,787
Time deposits – savings 15,450 15,189 21,343
Time deposits – other 59,025 48,474 28,118
Total overseas offices (see below) 89,883 80,509 66,967
Total deposits 304,286 273,881 239,033
Banking business 251,986 230,144 211,942
Trading business 52,300 43,737 27,091
Total deposits 304,286 273,881 239,033
Overseas
US 67,019 61,738 49,815
Rest of the World 22,864 18,771 17,152
Total overseas 89,883 80,509 66,967