RBS 2003 Annual Report Download - page 110
Download and view the complete annual report
Please find page 110 of the 2003 RBS annual report below. You can navigate through the pages in the report by either clicking on the pages listed below, or by using the keyword search tool below to find specific information within the annual report.-
 1
1 -
2
-
3
-
4
-
5
-
6
-
7
-
8
-
9
-
10
-
11
-
12
-
13
-
14
-
15
-
16
-
17
-
18
-
19
-
20
-
21
-
22
-
23
-
24
-
25
-
26
-
27
-
28
-
29
-
30
-
31
-
32
-
33
-
34
-
35
-
36
-
37
-
38
-
39
-
40
-
41
-
42
-
43
-
44
-
45
-
46
-
47
-
48
-
49
-
50
-
51
-
52
-
53
-
54
-
55
-
56
-
57
-
58
-
59
-
60
-
61
-
62
-
63
-
64
-
65
-
66
-
67
-
68
-
69
-
70
-
71
-
72
-
73
-
74
-
75
-
76
-
77
-
78
-
79
-
80
-
81
-
82
-
83
-
84
-
85
-
86
-
87
-
88
-
89
-
90
-
91
-
92
-
93
-
94
-
95
-
96
-
97
-
98
-
99
-
 100
100 -
 101
101 -
 102
102 -
 103
103 -
 104
104 -
 105
105 -
 106
106 -
 107
107 -
 108
108 -
 109
109 -
 110
110 -
 111
111 -
 112
112 -
 113
113 -
 114
114 -
 115
115 -
 116
116 -
 117
117 -
 118
118 -
 119
119 -
 120
120 -
121
-
122
-
123
-
124
-
125
-
126
-
127
-
128
-
129
-
130
-
131
-
132
-
133
-
134
-
135
-
136
-
137
-
138
-
139
-
140
-
141
-
142
-
143
-
144
-
145
-
146
-
147
-
148
-
149
-
150
-
151
-
152
-
153
-
154
-
155
-
156
-
157
-
158
-
159
-
160
-
161
-
162
-
163
-
164
-
165
-
166
-
167
-
168
-
169
-
170
-
171
-
172
-
173
-
174
-
175
-
176
-
177
-
178
-
179
-
180
-
181
-
182
-
183
-
184
-
185
-
186
-
187
-
188
-
189
-
190
-
191
-
192
-
193
-
194
-
195
-
196
-
197
-
198
-
199
-
200
-
201
-
202
-
203
-
204
-
205
-
206
-
207
-
208
-
209
-
210
-
211
-
212
-
213
-
214
-
215
-
216
-
217
-
218
-
219
-
220
-
221
-
222
-
223
-
224
-
225
-
226
-
227
-
228
-
229
-
230
 |
 |

Operating and financial review continued
108
Operating and financial review
Market risk (continued)
Non-trading (continued)
Currency risk
The Group does not maintain material non-trading open
currency positions other than the structural foreign currency
translation exposures arising from its investments in overseas
subsidiaries and associated undertakings and their related
currency funding. The Group’s policy in relation to structural
positions is to match fund the structural foreign currency
exposure arising from net asset value, including goodwill, in
overseas subsidiaries, equity accounted investments and
branches, except where doing so would materially increase the
sensitivity of either the Group’s or the subsidiary’s regulatory
capital ratios to currency movements. The policy requires
structural foreign exchange positions to be reviewed regularly
by GALCO. Gains or losses on foreign currency investments
net of any gains or losses on related foreign currency funding
or hedges are recognised in the statement of total recognised
gains and losses.
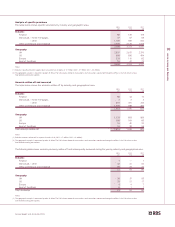
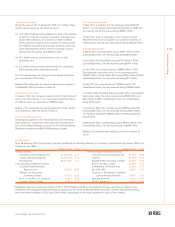
The tables below set out the Group’s structural foreign currency exposures.
Foreign
currency Structural
Net investments borrowings foreign
in overseas hedging net currency
operations investments exposures
2003 £m £m £m
US dollar 5,329 5,198 131
Euro 1,422 826 596
Swiss franc 357 357 —
Other non-sterling 118 114 4
7,226 6,495 731
2002
US dollar 5,190 5,107 83
Euro 1,019 558 461
Swiss franc 306 295 11
Other non-sterling 35 30 5
6,550 5,990 560
The structural foreign currency exposure in euros is principally due to Ulster Bank running an open structural foreign exchange
position to minimise the sensitivity of its capital ratios to possible movements in the Euro exchange rate against Sterling.
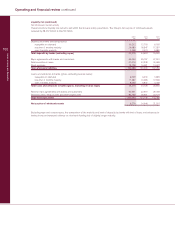
Equity risk
Non-trading equity risk arises principally from the Group’s
strategic investments, its venture capital activities and its general
insurance business. The reserves of the Group’s general
insurance business are invested in cash, debt securities and
equity shares. The VaR of the equity element of this portfolio
was £9.9 million at 31 December 2003 (2002 – £8.6 million).
During 2003, the maximum VaR was £11.1 million (2002 – £8.6
million), the minimum £8.3 million (2002 – £6.8 million) and the
average £9.6 million (2002 – £7.4 million).
VaR is not an appropriate risk measure for the Group’s venture
capital investments, comprising a mix of quoted and unquoted
investments, or its portfolio of strategic investments. At 31
December 2003, equity shares held as investment securities
had a book value of £1,821 million (2002 – £1,783 million) and
a valuation of £2,238 million (2002 – £1,699 million).