RBS 2003 Annual Report Download - page 79
Download and view the complete annual report
Please find page 79 of the 2003 RBS annual report below. You can navigate through the pages in the report by either clicking on the pages listed below, or by using the keyword search tool below to find specific information within the annual report.-
 1
1 -
2
-
3
-
4
-
5
-
6
-
7
-
8
-
9
-
10
-
11
-
12
-
13
-
14
-
15
-
16
-
17
-
18
-
19
-
20
-
21
-
22
-
23
-
24
-
25
-
26
-
27
-
28
-
29
-
30
-
31
-
32
-
33
-
34
-
35
-
36
-
37
-
38
-
39
-
40
-
41
-
42
-
43
-
44
-
45
-
46
-
47
-
48
-
49
-
50
-
51
-
52
-
53
-
54
-
55
-
56
-
57
-
58
-
59
-
60
-
61
-
62
-
63
-
64
-
65
-
66
-
67
-
68
-
 69
69 -
 70
70 -
 71
71 -
 72
72 -
 73
73 -
 74
74 -
 75
75 -
 76
76 -
 77
77 -
 78
78 -
 79
79 -
 80
80 -
 81
81 -
 82
82 -
 83
83 -
 84
84 -
 85
85 -
 86
86 -
 87
87 -
 88
88 -
 89
89 -
90
-
91
-
92
-
93
-
94
-
95
-
96
-
97
-
98
-
99
-
100
-
101
-
102
-
103
-
104
-
105
-
106
-
107
-
108
-
109
-
110
-
111
-
112
-
113
-
114
-
115
-
116
-
117
-
118
-
119
-
120
-
121
-
122
-
123
-
124
-
125
-
126
-
127
-
128
-
129
-
130
-
131
-
132
-
133
-
134
-
135
-
136
-
137
-
138
-
139
-
140
-
141
-
142
-
143
-
144
-
145
-
146
-
147
-
148
-
149
-
150
-
151
-
152
-
153
-
154
-
155
-
156
-
157
-
158
-
159
-
160
-
161
-
162
-
163
-
164
-
165
-
166
-
167
-
168
-
169
-
170
-
171
-
172
-
173
-
174
-
175
-
176
-
177
-
178
-
179
-
180
-
181
-
182
-
183
-
184
-
185
-
186
-
187
-
188
-
189
-
190
-
191
-
192
-
193
-
194
-
195
-
196
-
197
-
198
-
199
-
200
-
201
-
202
-
203
-
204
-
205
-
206
-
207
-
208
-
209
-
210
-
211
-
212
-
213
-
214
-
215
-
216
-
217
-
218
-
219
-
220
-
221
-
222
-
223
-
224
-
225
-
226
-
227
-
228
-
229
-
230
 |
 |

77
Operating and financial review
Annual Report and Accounts 2003
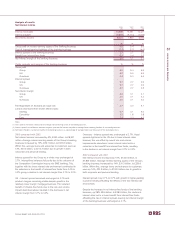
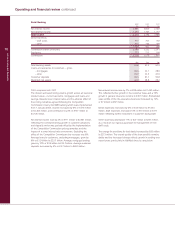
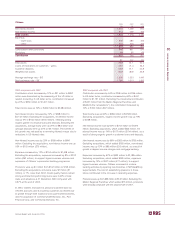
operating expenses were up 10%, £161 million. This was due
to performance related costs associated with the strong growth
in trading revenues, expansion in all business areas and
continued investment in capital market activities and in the
growing overseas franchise.
The charge for provisions for bad debts and amounts written
off fixed asset investments amounted to £755 million, an
increase of £30 million. The charge in the second half of the
year was £351 million, 13% lower than the first half. The
increase in provisions of 4% over last year was less than the
growth in lending of 9%, reflecting an improvement in credit
quality and the economic environment during 2003.
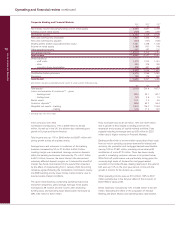
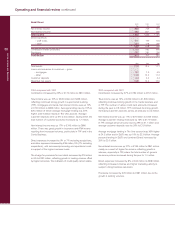
2002 compared with 2001
Contribution increased by 6% or £181 million to £3,261 million.
Contribution before provisions was up by 11%, £404 million to
£3,986 million.
Total income was up 11% or £595 million to £6,052 million.
Excluding acquisitions, which added £67 million, total income
increased 10%.
Net interest income rose by 10% or £211 million to £2,349
million, reflecting customer lending growth in Corporate
Banking and continued good performance by Financial
Markets from strong wholesale money market activity. Average
loans and advances to customers of the banking business
increased by 12%, £9.3 billion to £86.9 billion.
Non-interest income rose by 12% or £384 million to £3,703
million, mainly as a result of increased fees, reflecting growth
in lending and in payment and electronic banking activities.
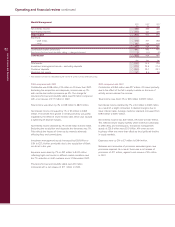
Dealing profits benefited from continued customer led
business growth and higher revenues from trading in interest
rate instruments and matched the strong performance of 2001.
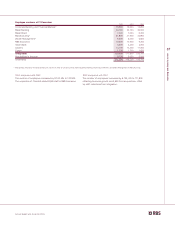
Operating lease business expanded significantly during 2002
with average assets increasing by 23% from £3.5 billion to £4.3
billion resulting in higher income, up 16%, £112 million.
Direct expenses increased by 10% or £191 million to £2,066
million. Excluding acquisitions, expenses were up £131 million
or 7%, of which £104 million was higher staff costs reflecting
business growth and £27 million was higher operating lease
depreciation.
Provisions amounted to £725 million compared with £502
million in 2001. The increase reflected growth in lending and,
as in the second half of 2001, provisions required against a
number of specific corporate situations, and higher investment
provisions.