RBS 2003 Annual Report Download - page 202
Download and view the complete annual report
Please find page 202 of the 2003 RBS annual report below. You can navigate through the pages in the report by either clicking on the pages listed below, or by using the keyword search tool below to find specific information within the annual report.-
 1
1 -
2
-
3
-
4
-
5
-
6
-
7
-
8
-
9
-
10
-
11
-
12
-
13
-
14
-
15
-
16
-
17
-
18
-
19
-
20
-
21
-
22
-
23
-
24
-
25
-
26
-
27
-
28
-
29
-
30
-
31
-
32
-
33
-
34
-
35
-
36
-
37
-
38
-
39
-
40
-
41
-
42
-
43
-
44
-
45
-
46
-
47
-
48
-
49
-
50
-
51
-
52
-
53
-
54
-
55
-
56
-
57
-
58
-
59
-
60
-
61
-
62
-
63
-
64
-
65
-
66
-
67
-
68
-
69
-
70
-
71
-
72
-
73
-
74
-
75
-
76
-
77
-
78
-
79
-
80
-
81
-
82
-
83
-
84
-
85
-
86
-
87
-
88
-
89
-
90
-
91
-
92
-
93
-
94
-
95
-
96
-
97
-
98
-
99
-
100
-
101
-
102
-
103
-
104
-
105
-
106
-
107
-
108
-
109
-
110
-
111
-
112
-
113
-
114
-
115
-
116
-
117
-
118
-
119
-
120
-
121
-
122
-
123
-
124
-
125
-
126
-
127
-
128
-
129
-
130
-
131
-
132
-
133
-
134
-
135
-
136
-
137
-
138
-
139
-
140
-
141
-
142
-
143
-
144
-
145
-
146
-
147
-
148
-
149
-
150
-
151
-
152
-
153
-
154
-
155
-
156
-
157
-
158
-
159
-
160
-
161
-
162
-
163
-
164
-
165
-
166
-
167
-
168
-
169
-
170
-
171
-
172
-
173
-
174
-
175
-
176
-
177
-
178
-
179
-
180
-
181
-
182
-
183
-
184
-
185
-
186
-
187
-
188
-
189
-
190
-
191
-
 192
192 -
 193
193 -
 194
194 -
 195
195 -
 196
196 -
 197
197 -
 198
198 -
 199
199 -
 200
200 -
 201
201 -
 202
202 -
 203
203 -
 204
204 -
 205
205 -
 206
206 -
 207
207 -
 208
208 -
 209
209 -
 210
210 -
 211
211 -
 212
212 -
213
-
214
-
215
-
216
-
217
-
218
-
219
-
220
-
221
-
222
-
223
-
224
-
225
-
226
-
227
-
228
-
229
-
230
 |
 |

200
Additional information
Additional information
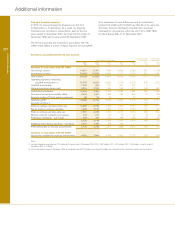
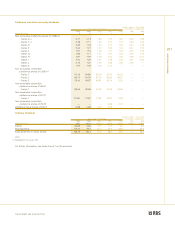
Five year financial summary
In 2000, the Group changed its financial year end from
30 September to 31 December. As a result, the financial
information set out below is presented for each of the four
years ended 31 December 2003, the three months ended 31
December 1999 and the year ended 30 September 1999.
The Group’s accounts are prepared in accordance with UK
GAAP, which differs in certain material respects from US GAAP.
For a discussion of such differences and a reconciliation
between UK GAAP and US GAAP, see Note 53 on the accounts.
The dollar financial information included below has been
translated for convenience at the rate of £1.00 to US$1.7842,
the Noon Buying Rate on 31 December 2003.
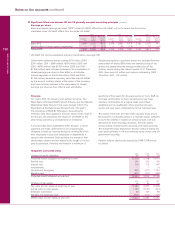
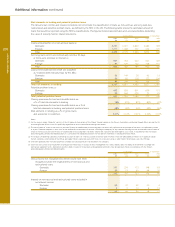
Summary consolidated profit and loss account
3 months ended Year ended
Year ended 31 December 31 December 30 September
2003 2003 2002 2001 2000 1999 1999
$m £m £m £m £m £m £m
Amounts in accordance with UK GAAP:
Net interest income 14,810 8,301 7,849 6,846 5,286 501 1,748
Non-interest income 19,498 10,928 8,966 7,712 5,709 612 2,354
Total income 34,308 19,229 16,815 14,558 10,995 1,113 4,102
Operating expenses excluding
goodwill amortisation (1) 15,376 8,618 8,626 7,716 6,223 542 2,021
Goodwill amortisation 1,362 763 731 651 537 4 1
General insurance claims (net) 3,916 2,195 1,350 948 673 185 590
Profit before provisions 13,654 7,653 6,108 5,243 3,562 382 1,490
Provisions for bad and doubtful debts 2,606 1,461 1,286 984 550 79 266
Amounts written off fixed asset investments 59 33 59 7 42 — 13
Operating profit 10,989 6,159 4,763 4,252 2,970 303 1,211
Exceptional items (2) ——— — — 100 —
Profit on ordinary activities before tax 10,989 6,159 4,763 4,252 2,970 403 1,211
Tax on profit on ordinary activities 3,408 1,910 1,556 1,537 1,054 123 364
Profit on ordinary activities after tax 7,581 4,249 3,207 2,715 1,916 280 847
Minority interests (including non-equity) 375 210 133 90 50 (3) (6)
Preference dividends – non-equity 466 261 305 358 294 28 80
6,740 3,778 2,769 2,267 1,572 255 773
Additional Value Shares dividend – non-equity 2,610 1,463 798 399 — — —
Profit attributable to ordinary shareholders 4,130 2,315 1,971 1,868 1,572 255 773
Amounts in accordance with US GAAP:
Net income available for ordinary shareholders 4,575 2,564 3,108 2,062 2,102 239 678
Notes:
(1) Includes integration expenditure of £229 million for the year ended 31 December 2003 (2002 – £957 million; 2001 – £875 million; 2000 – £389 million; 3 months ended 31
December 1999 – £12 million).
(2) In the three months ended 31 December 1999, an exceptional gain of £100 million (tax charge £31 million) was realised from the sale of the investor services business.