RBS 2003 Annual Report Download - page 162
Download and view the complete annual report
Please find page 162 of the 2003 RBS annual report below. You can navigate through the pages in the report by either clicking on the pages listed below, or by using the keyword search tool below to find specific information within the annual report.-
 1
1 -
2
-
3
-
4
-
5
-
6
-
7
-
8
-
9
-
10
-
11
-
12
-
13
-
14
-
15
-
16
-
17
-
18
-
19
-
20
-
21
-
22
-
23
-
24
-
25
-
26
-
27
-
28
-
29
-
30
-
31
-
32
-
33
-
34
-
35
-
36
-
37
-
38
-
39
-
40
-
41
-
42
-
43
-
44
-
45
-
46
-
47
-
48
-
49
-
50
-
51
-
52
-
53
-
54
-
55
-
56
-
57
-
58
-
59
-
60
-
61
-
62
-
63
-
64
-
65
-
66
-
67
-
68
-
69
-
70
-
71
-
72
-
73
-
74
-
75
-
76
-
77
-
78
-
79
-
80
-
81
-
82
-
83
-
84
-
85
-
86
-
87
-
88
-
89
-
90
-
91
-
92
-
93
-
94
-
95
-
96
-
97
-
98
-
99
-
100
-
101
-
102
-
103
-
104
-
105
-
106
-
107
-
108
-
109
-
110
-
111
-
112
-
113
-
114
-
115
-
116
-
117
-
118
-
119
-
120
-
121
-
122
-
123
-
124
-
125
-
126
-
127
-
128
-
129
-
130
-
131
-
132
-
133
-
134
-
135
-
136
-
137
-
138
-
139
-
140
-
141
-
142
-
143
-
144
-
145
-
146
-
147
-
148
-
149
-
150
-
151
-
 152
152 -
 153
153 -
 154
154 -
 155
155 -
 156
156 -
 157
157 -
 158
158 -
 159
159 -
 160
160 -
 161
161 -
 162
162 -
 163
163 -
 164
164 -
 165
165 -
 166
166 -
 167
167 -
 168
168 -
 169
169 -
 170
170 -
 171
171 -
 172
172 -
173
-
174
-
175
-
176
-
177
-
178
-
179
-
180
-
181
-
182
-
183
-
184
-
185
-
186
-
187
-
188
-
189
-
190
-
191
-
192
-
193
-
194
-
195
-
196
-
197
-
198
-
199
-
200
-
201
-
202
-
203
-
204
-
205
-
206
-
207
-
208
-
209
-
210
-
211
-
212
-
213
-
214
-
215
-
216
-
217
-
218
-
219
-
220
-
221
-
222
-
223
-
224
-
225
-
226
-
227
-
228
-
229
-
230
 |
 |
160
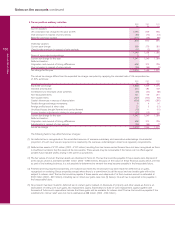
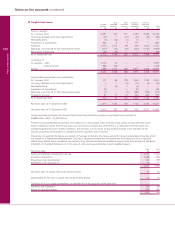
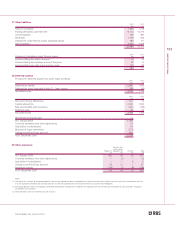
20 Tangible fixed assets Long Short Computers Assets on
Freehold leasehold leasehold and other operating
premises premises premises equipment leases Total
£m £m £m £m £m £m
Cost or valuation:
At 1 January 2003 3,951 367 611 2,754 6,335 14,018
Currency translation and other adjustments (23) 1 (10) (24) (24) (80)
Reclassifications (9) (24) (1) 34 — —
Acquisition of subsidiaries 561 8 4 111 — 684
Additions 1,015 1,034 84 480 2,404 5,017
Disposals and write-off of fully depreciated assets (227) (22) (33) (444) (1,167) (1,893)
Revaluation adjustments (51) (18) — — — (69)
At 31 December 2003 5,217 1,346 655 2,911 7,548 17,677
Consisting of:
At valuation – 2003 2,750 37———2,787
At valuation – 2002 and prior 882 166———1,048
At cost 1,585 1,143 655 2,911 7,548 13,842
5,217 1,346 655 2,911 7,548 17,677
Accumulated depreciation and amortisation:
At 1 January 2003 327 85 229 1,854 1,038 3,533
Currency translation and other adjustments — 1 (6) (10) (4) (19)
Reclassifications 7 (3) 1 (5) — —
Acquisition of subsidiaries 29 — — 59 — 88
Disposals and write-off of fully depreciated assets (7) — (7) (387) (370) (771)
Charge for the year 51 11 33 294 530 919
At 31 December 2003 407 94 250 1,805 1,194 3,750
Net book value at 31 December 2003 4,810 1,252 405 1,106 6,354 13,927
Net book value at 31 December 2002 3,624 282 382 900 5,297 10,485
On the historical cost basis, the Group’s freehold and long leasehold premises would have been included at
£5,886 million (2002 – £3,638 million).
Freehold and long leasehold properties are revalued on a rolling basis, each property being valued at least every five years.
Interim valuations outwith the five year cycle are carried out on properties where there is an indication that their value has
changed significantly, given market conditions. The directors are not aware of any material change in the valuation of the
Group’s properties and therefore no additional interim valuations were required.
Properties occupied by the Group are valued on the basis of Existing Use Value, except for certain specialised properties which
are valued on a Depreciated Replacement Cost basis. Investment properties and properties to be disposed of are valued to
reflect Open Market Value. Valuations are carried out by internal and external qualified surveyors who are members of the Royal
Institution of Chartered Surveyors or, in the case of some overseas properties, locally qualified valuers.
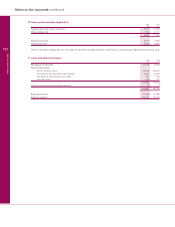
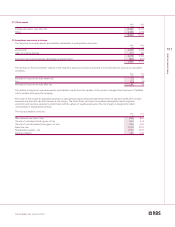
2003 2002
Net book value: £m £m
Land and buildings occupied for own use 2,391 2,230
Investment properties 3,628 1,789
Properties under development 429 258
Properties to be disposed of 19 11
6,467 4,288
Net book value of assets held under finance leases 90 94
Depreciation for the year of assets held under finance leases 20 34
Contracts for future capital expenditure not provided for in the accounts at the year end
Premises and equipment 104 68
Assets on operating leases 498 678
602 746
Notes on the accounts continued
Notes on the accounts