RBS 2003 Annual Report Download - page 93
Download and view the complete annual report
Please find page 93 of the 2003 RBS annual report below. You can navigate through the pages in the report by either clicking on the pages listed below, or by using the keyword search tool below to find specific information within the annual report.-
 1
1 -
2
-
3
-
4
-
5
-
6
-
7
-
8
-
9
-
10
-
11
-
12
-
13
-
14
-
15
-
16
-
17
-
18
-
19
-
20
-
21
-
22
-
23
-
24
-
25
-
26
-
27
-
28
-
29
-
30
-
31
-
32
-
33
-
34
-
35
-
36
-
37
-
38
-
39
-
40
-
41
-
42
-
43
-
44
-
45
-
46
-
47
-
48
-
49
-
50
-
51
-
52
-
53
-
54
-
55
-
56
-
57
-
58
-
59
-
60
-
61
-
62
-
63
-
64
-
65
-
66
-
67
-
68
-
69
-
70
-
71
-
72
-
73
-
74
-
75
-
76
-
77
-
78
-
79
-
80
-
81
-
82
-
 83
83 -
 84
84 -
 85
85 -
 86
86 -
 87
87 -
 88
88 -
 89
89 -
 90
90 -
 91
91 -
 92
92 -
 93
93 -
 94
94 -
 95
95 -
 96
96 -
 97
97 -
 98
98 -
 99
99 -
 100
100 -
 101
101 -
 102
102 -
 103
103 -
104
-
105
-
106
-
107
-
108
-
109
-
110
-
111
-
112
-
113
-
114
-
115
-
116
-
117
-
118
-
119
-
120
-
121
-
122
-
123
-
124
-
125
-
126
-
127
-
128
-
129
-
130
-
131
-
132
-
133
-
134
-
135
-
136
-
137
-
138
-
139
-
140
-
141
-
142
-
143
-
144
-
145
-
146
-
147
-
148
-
149
-
150
-
151
-
152
-
153
-
154
-
155
-
156
-
157
-
158
-
159
-
160
-
161
-
162
-
163
-
164
-
165
-
166
-
167
-
168
-
169
-
170
-
171
-
172
-
173
-
174
-
175
-
176
-
177
-
178
-
179
-
180
-
181
-
182
-
183
-
184
-
185
-
186
-
187
-
188
-
189
-
190
-
191
-
192
-
193
-
194
-
195
-
196
-
197
-
198
-
199
-
200
-
201
-
202
-
203
-
204
-
205
-
206
-
207
-
208
-
209
-
210
-
211
-
212
-
213
-
214
-
215
-
216
-
217
-
218
-
219
-
220
-
221
-
222
-
223
-
224
-
225
-
226
-
227
-
228
-
229
-
230
 |
 |

91
Annual Report and Accounts 2003
Operating and financial review
UK GAAP compared with US GAAP
The Group’s financial statements are prepared in accordance
with UK GAAP, which differs in certain material respects from
US GAAP as described on pages 186 to 198.
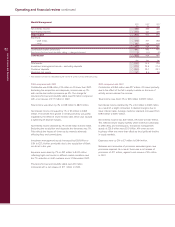
The net income available for ordinary shareholders under US
GAAP was £2,564 million, £249 million higher than profit
attributable to ordinary shareholders under UK GAAP of
£2,315 million. The principal reasons for the increase are:
•Goodwill amortisation is charged to the profit and loss under
UK GAAP, whereas under US GAAP only intangible assets
other than goodwill are amortised, resulting in an increase in
net income before tax of £721 million.
•Certain software development costs have been charged to
the profit and loss account under UK GAAP; under US
GAAP such costs are capitalised and depreciated over the
estimated useful life of the software, resulting in a net
decrease in net income before tax of £300 million.
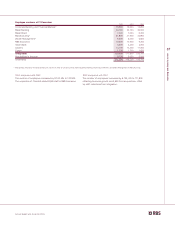
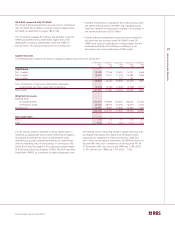
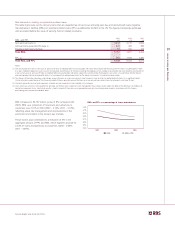
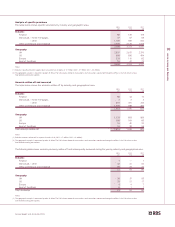
Capital resources
The following table analyses the Group’s regulatory capital resources at the period end:
31 December 31 December 31 December 31 December 30 September
2003 2002 2001 2000 1999
£m £m £m £m £m
Capital base
Tier 1 capital 19,399 17,155 15,052 12,071 4,605
Tier 2 capital 16,439 13,271 11,734 10,082 3,256
Tier 3 capital — — 172 167 —
35,838 30,426 26,958 22,320 7,861
Less: investments in insurance subsidiaries, associated
undertakings and other supervisory deductions (4,618) (3,146) (2,698) (2,228) (1,011)
Total capital 31,220 27,280 24,260 20,092 6,850
Weighted risk assets
Banking book:
On-balance sheet 214,400 193,800 176,000 146,600 51,200
Off-balance sheet 36,400 28,700 22,000 16,200 4,200
Trading book 12,900 11,500 12,500 12,400 1,400
263,700 234,000 210,500 175,200 56,800
Risk asset ratios %%%%%
Tier 1 7.4 7.3 7.1 6.9 8.1
Total 11.8 11.7 11.5 11.5 12.1
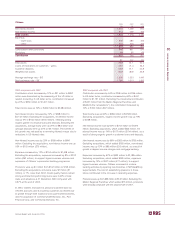
It is the Group’s policy to maintain a strong capital base, to
expand it as appropriate and to utilise it efficiently throughout
its activities to optimise the return to shareholders while
maintaining a prudent relationship between the capital base
and the underlying risks of the business. In carrying out this
policy, the Group has regard to the supervisory requirements
of the Financial Services Authority (“FSA”). The FSA uses Risk
Asset Ratio (“RAR”) as a measure of capital adequacy in the
UK banking sector, comparing a bank’s capital resources with
its weighted risk assets (the assets and off-balance sheet
exposures are ‘weighted’ to reflect the inherent credit and
other risks); by international agreement, the RAR should be not
less than 8% with a tier 1 component of not less than 4%. At
31 December 2003, the Group’s total RAR was 11.8% (2002 –
11.7%) and the tier 1 RAR was 7.4% (2002 – 7.3%).