BB&T 2012 Annual Report Download - page 102
Download and view the complete annual report
Please find page 102 of the 2012 BB&T annual report below. You can navigate through the pages in the report by either clicking on the pages listed below, or by using the keyword search tool below to find specific information within the annual report.-
 1
1 -
2
-
3
-
4
-
5
-
6
-
7
-
8
-
9
-
10
-
11
-
12
-
13
-
14
-
15
-
16
-
17
-
18
-
19
-
20
-
21
-
22
-
23
-
24
-
25
-
26
-
27
-
28
-
29
-
30
-
31
-
32
-
33
-
34
-
35
-
36
-
37
-
38
-
39
-
40
-
41
-
42
-
43
-
44
-
45
-
46
-
47
-
48
-
49
-
50
-
51
-
52
-
53
-
54
-
55
-
56
-
57
-
58
-
59
-
60
-
61
-
62
-
63
-
64
-
65
-
66
-
67
-
68
-
69
-
70
-
71
-
72
-
73
-
74
-
75
-
76
-
77
-
78
-
79
-
80
-
81
-
82
-
83
-
84
-
85
-
86
-
87
-
88
-
89
-
90
-
91
-
 92
92 -
 93
93 -
 94
94 -
 95
95 -
 96
96 -
 97
97 -
 98
98 -
 99
99 -
 100
100 -
 101
101 -
 102
102 -
 103
103 -
 104
104 -
 105
105 -
 106
106 -
 107
107 -
 108
108 -
 109
109 -
 110
110 -
 111
111 -
 112
112 -
113
-
114
-
115
-
116
-
117
-
118
-
119
-
120
-
121
-
122
-
123
-
124
-
125
-
126
-
127
-
128
-
129
-
130
-
131
-
132
-
133
-
134
-
135
-
136
-
137
-
138
-
139
-
140
-
141
-
142
-
143
-
144
-
145
-
146
-
147
-
148
-
149
-
150
-
151
-
152
-
153
-
154
-
155
-
156
-
157
-
158
-
159
-
160
-
161
-
162
-
163
-
164
-
165
-
166
-
167
-
168
-
169
-
170
-
171
-
172
-
173
-
174
-
175
-
176
 |
 |

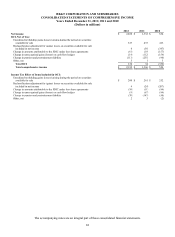
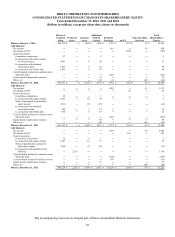
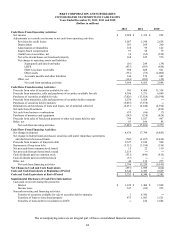
The accompanying notes are an integral part of these consolidated financial statements.
80
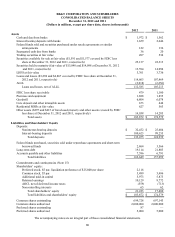
BB&T CORPORATION AND SUBSIDIARIES
CONSOLIDATED BALANCE SHEETS
December 31, 2012 and 2011
(Dollars in millions, except per share data, shares in thousands)
2012 2011
Assets
Cash and due from banks $ 1,972 $ 1,562
Interest-bearing deposits with banks 1,659 2,646
Federal funds sold and securities purchased under resale agreements or similar
arrangements 122 136
Segregated cash due from banks 36 20
Trading securities at fair value 497 534
Securities available for sale at fair value ($1,591 and $1,577 covered by FDIC loss
share at December 31, 2012 and 2011, respectively) 25,137 22,313
Securities held to maturity (fair value of $13,848 and $14,098 at December 31, 2012
and 2011, respectively) 13,594 14,094
LHFS at fair value 3,761 3,736
Loans and leases ($3,294 and $4,867 covered by FDIC loss share at December 31,
2012 and 2011, respectively) 114,603 107,469
ALLL (2,018) (2,256)
Loans and leases, net of ALLL 112,585 105,213
FDIC loss share receivable 479 1,100
Premises and equipment 1,888 1,855
Goodwill 6,804 6,078
Core deposit and other intangible assets 673 444
Residential MSRs at fair value 627 563
Other assets ($297 and $415 of foreclosed property and other assets covered by FDIC
loss share at December 31, 2012 and 2011, respectively) 14,038 14,285
Total assets $ 183,872 $ 174,579
Liabilities and Shareholders’ Equity
Deposits:
N
oninteres
t
-bearing deposits $ 32,452 $ 25,684
Interest-bearing deposits 100,623 99,255
Total deposits 133,075 124,939
Federal funds purchased, securities sold under repurchase agreements and short-term
borrowed funds 2,864 3,566
Long-term debt 19,114 21,803
Accounts payable and other liabilities 7,596 6,791
Total liabilities 162,649 157,099
Commitments and contingencies (Note 15)
Shareholders’ equity:
Preferred stock, $5 par, liquidation preference of $25,000 per share 2,116 —
Common stock, $5 par 3,499 3,486
Additional paid-in capital 5,973 5,873
Retained earnings 10,129 8,772
AOCI, net of deferred income taxes (559) (713)
N
oncontrolling interests 65 62
Total shareholders’ equity 21,223 17,480
Total liabilities and shareholders’ equity $ 183,872 $ 174,579
Common shares outstanding 699,728 697,143
Common shares authorized 2,000,000 2,000,000
Preferred shares outstanding 87 —
Preferred shares authorized 5,000 5,000