BB&T 2012 Annual Report Download - page 99
Download and view the complete annual report
Please find page 99 of the 2012 BB&T annual report below. You can navigate through the pages in the report by either clicking on the pages listed below, or by using the keyword search tool below to find specific information within the annual report.-
 1
1 -
2
-
3
-
4
-
5
-
6
-
7
-
8
-
9
-
10
-
11
-
12
-
13
-
14
-
15
-
16
-
17
-
18
-
19
-
20
-
21
-
22
-
23
-
24
-
25
-
26
-
27
-
28
-
29
-
30
-
31
-
32
-
33
-
34
-
35
-
36
-
37
-
38
-
39
-
40
-
41
-
42
-
43
-
44
-
45
-
46
-
47
-
48
-
49
-
50
-
51
-
52
-
53
-
54
-
55
-
56
-
57
-
58
-
59
-
60
-
61
-
62
-
63
-
64
-
65
-
66
-
67
-
68
-
69
-
70
-
71
-
72
-
73
-
74
-
75
-
76
-
77
-
78
-
79
-
80
-
81
-
82
-
83
-
84
-
85
-
86
-
87
-
88
-
 89
89 -
 90
90 -
 91
91 -
 92
92 -
 93
93 -
 94
94 -
 95
95 -
 96
96 -
 97
97 -
 98
98 -
 99
99 -
 100
100 -
 101
101 -
 102
102 -
 103
103 -
 104
104 -
 105
105 -
 106
106 -
 107
107 -
 108
108 -
 109
109 -
110
-
111
-
112
-
113
-
114
-
115
-
116
-
117
-
118
-
119
-
120
-
121
-
122
-
123
-
124
-
125
-
126
-
127
-
128
-
129
-
130
-
131
-
132
-
133
-
134
-
135
-
136
-
137
-
138
-
139
-
140
-
141
-
142
-
143
-
144
-
145
-
146
-
147
-
148
-
149
-
150
-
151
-
152
-
153
-
154
-
155
-
156
-
157
-
158
-
159
-
160
-
161
-
162
-
163
-
164
-
165
-
166
-
167
-
168
-
169
-
170
-
171
-
172
-
173
-
174
-
175
-
176
 |
 |

77
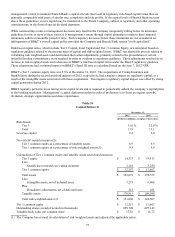
The provision for credit losses, excluding covered loans, for the fourth quarter of 2012 totaled $256 million, compared to
$223 million for fourth quarter of 2011. The increase in the provision for credit losses reflects a smaller reserve release in the
fourth quarter of 2012 than was recorded in the same quarter of the prior year. Net charge-offs, excluding covered loans, for
the fourth quarter of 2012 were $85 million lower than the fourth quarter of 2011 reflecting improved credit quality. NPAs
declined $914 million, or 37.3% compared to the fourth quarter of 2011.
The provision for income taxes was $207 million for the fourth quarter of 2012 compared to $84 million for the fourth
quarter of 2011. The effective tax rate for the fourth quarter of 2012 was 27.4% compared to 17.4% for the prior year’ s
fourth quarter. The increase in the effective tax rate was primarily due to higher levels of pre-tax earnings relative to
permanent tax differences in 2012 compared to 2011.
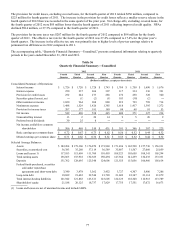
The accompanying table, “Quarterly Financial Summary—Unaudited,” presents condensed information relating to quarterly
periods in the years ended December 31, 2012 and 2011.
Table 36
Quarterly Financial Summary―Unaudited
2012 2011
Fourth Third Second First Fourth Third Second First
Quarter Quarter Quarter Quarter Quarter Quarter Quarter Quarter
(Dollars in millions, except per share data)
Consolidated Summary of Operations:
Interest income $ 1,726 $ 1,720 $ 1,728 $ 1,743 $ 1,769 $ 1,750 $ 1,690 $ 1,676
Interest expense 250 237 266 307 317 334 336 391
Provision for credit losses 252 244 273 288 272 250 328 340
Securities gains (losses), net ― (1) (2) (9) 103 (39) (2) ―
Other noninterest income 1,020 964 968 880 819 729 789 714
N
oninterest expense 1,488 1,529 1,426 1,385 1,618 1,417 1,395 1,372
Provision for income taxes 207 177 191 189 84 68 91 53
N
et income 549 496 538 445 400 371 327 234
N
oncontrolling interest 13 2 20 14 9 5 20 9
Preferred stock dividends 30 25 8 ― ― ― ― ―
N
et income available to common
shareholders $ 506 $ 469 $ 510 $ 431 $ 391 $ 366 $ 307 $ 225
Basic earnings per common share $ 0.72 $ 0.67 $ 0.73 $ 0.62 $ 0.56 $ 0.52 $ 0.44 $ 0.32
Diluted earnings per common share $ 0.71 $ 0.66 $ 0.72 $ 0.61 $ 0.55 $ 0.52 $ 0.44 $ 0.32
Selected Average Balances:
Assets $ 182,204 $ 179,306 $ 176,870 $ 173,969 $ 171,496 $ 165,520 $ 157,730 $ 156,931
Securities, at amortized cost 36,383 35,260 37,114 36,589 35,867 31,567 27,060 25,059
Loans and leases (1) 117,103 115,609 111,760 110,403 108,523 105,658 104,341 105,294
Total earning assets 156,863 153,918 152,385 150,494 147,364 141,259 134,235 133,331
Deposits 131,762 128,695 125,348 124,606 121,925 115,056 106,466 105,614
Federal funds purchased, securities
sold under repurchase
agreements and short-term debt 3,340 3,478 3,362 3,452 3,727 4,307 5,486 7,286
Long-term debt 18,689 19,682 22,544 21,720 21,689 22,347 23,114 21,879
Total interest-bearing liabilities 121,942 121,865 123,611 123,605 122,125 118,340 112,915 113,789
Shareholders' equity 21,188 20,125 18,737 17,829 17,755 17,551 17,072 16,673
(1) Loans and leases are net of unearned income and include LHFS.