BB&T 2012 Annual Report Download - page 73
Download and view the complete annual report
Please find page 73 of the 2012 BB&T annual report below. You can navigate through the pages in the report by either clicking on the pages listed below, or by using the keyword search tool below to find specific information within the annual report.-
 1
1 -
2
-
3
-
4
-
5
-
6
-
7
-
8
-
9
-
10
-
11
-
12
-
13
-
14
-
15
-
16
-
17
-
18
-
19
-
20
-
21
-
22
-
23
-
24
-
25
-
26
-
27
-
28
-
29
-
30
-
31
-
32
-
33
-
34
-
35
-
36
-
37
-
38
-
39
-
40
-
41
-
42
-
43
-
44
-
45
-
46
-
47
-
48
-
49
-
50
-
51
-
52
-
53
-
54
-
55
-
56
-
57
-
58
-
59
-
60
-
61
-
62
-
 63
63 -
 64
64 -
 65
65 -
 66
66 -
 67
67 -
 68
68 -
 69
69 -
 70
70 -
 71
71 -
 72
72 -
 73
73 -
 74
74 -
 75
75 -
 76
76 -
 77
77 -
 78
78 -
 79
79 -
 80
80 -
 81
81 -
 82
82 -
 83
83 -
84
-
85
-
86
-
87
-
88
-
89
-
90
-
91
-
92
-
93
-
94
-
95
-
96
-
97
-
98
-
99
-
100
-
101
-
102
-
103
-
104
-
105
-
106
-
107
-
108
-
109
-
110
-
111
-
112
-
113
-
114
-
115
-
116
-
117
-
118
-
119
-
120
-
121
-
122
-
123
-
124
-
125
-
126
-
127
-
128
-
129
-
130
-
131
-
132
-
133
-
134
-
135
-
136
-
137
-
138
-
139
-
140
-
141
-
142
-
143
-
144
-
145
-
146
-
147
-
148
-
149
-
150
-
151
-
152
-
153
-
154
-
155
-
156
-
157
-
158
-
159
-
160
-
161
-
162
-
163
-
164
-
165
-
166
-
167
-
168
-
169
-
170
-
171
-
172
-
173
-
174
-
175
-
176
 |
 |
51
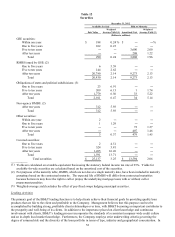
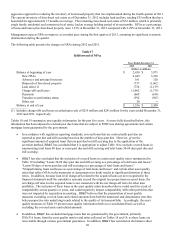
possible negative impacts on its regulatory capital under the proposed Basel III capital guidelines. In addition, management
purchased additional securities into the held-to-maturity portfolio based on its intent at the date of purchase.
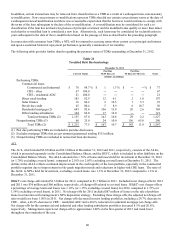
RMBS issued by GSEs were 78.0% of the total securities portfolio at year-end 2012. As of December 31, 2012, the
available-for-sale securities portfolio also includes $1.6 billion of securities that were acquired from the FDIC as part of the
Colonial acquisition. These securities are covered by FDIC loss sharing agreements and include $1.3 billion of non-agency
RMBS and $326 million of municipal securities.
During 2012, management sold $306 million of securities that produced a realized loss of $3 million. In addition, BB&T
recognized $9 million in charges for OTTI related to certain non-agency RMBS and covered securities. In 2011, primarily in
connection with strengthening its liquidity under the proposed Basel III liquidity guidelines, management purchased a total of
$13.4 billion of GNMA RMBS. Management also sold approximately $4.0 billion of securities during 2011, which produced
net securities gains of $174 million. In addition, BB&T recognized $112 million in charges for OTTI during 2011 related to
BB&T’ s portfolio of non-agency RMBS. The OTTI charges were the result of weaker actual and forecasted collateral
performance for non-agency RMBS.
In 2010, management executed two major strategies to strengthen the balance sheet. In the second quarter of 2010,
management executed a deleveraging strategy to better position BB&T’ s balance sheet for a rising rate environment and
achieve a better mix of earning assets. In connection with this strategy, management reduced the balance sheet by
approximately $8 billion through the sale of securities. During the third and fourth quarters of 2010, management executed a
strategy to further de-risk the available-for-sale securities portfolio. The de-risking strategy was aimed at further reducing the
duration of the securities portfolio and reducing the risk of charges to OCI in a rising rate environment. Also to further
protect against the risk of a rising rate environment, management replaced a portion of the securities sold with floating-rate
securities. In addition, management sold approximately $400 million of non-agency RMBS to reduce the potential for future
credit losses. These strategies were the primary driver in generating net securities gains during 2010. Primarily in
connection with these strategies, BB&T sold a total of $31.3 billion in available-for-sale securities during 2010, which
produced net securities gains of $585 million. In addition, BB&T recognized $31 million in charges for OTTI related to
BB&T’ s portfolio of non-agency RMBS.
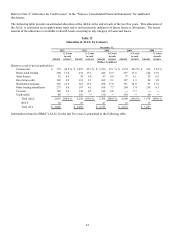
Refer to Note 2 “Securities” in the “Notes to Consolidated Financial Statements” herein for additional disclosures related to
BB&T’ s evaluation of securities for OTTI.
The following table presents BB&T’ s securities portfolio at December 31, 2012, segregated by major category with ranges of
maturities and average yields disclosed.