BB&T 2012 Annual Report Download - page 98
Download and view the complete annual report
Please find page 98 of the 2012 BB&T annual report below. You can navigate through the pages in the report by either clicking on the pages listed below, or by using the keyword search tool below to find specific information within the annual report.-
 1
1 -
2
-
3
-
4
-
5
-
6
-
7
-
8
-
9
-
10
-
11
-
12
-
13
-
14
-
15
-
16
-
17
-
18
-
19
-
20
-
21
-
22
-
23
-
24
-
25
-
26
-
27
-
28
-
29
-
30
-
31
-
32
-
33
-
34
-
35
-
36
-
37
-
38
-
39
-
40
-
41
-
42
-
43
-
44
-
45
-
46
-
47
-
48
-
49
-
50
-
51
-
52
-
53
-
54
-
55
-
56
-
57
-
58
-
59
-
60
-
61
-
62
-
63
-
64
-
65
-
66
-
67
-
68
-
69
-
70
-
71
-
72
-
73
-
74
-
75
-
76
-
77
-
78
-
79
-
80
-
81
-
82
-
83
-
84
-
85
-
86
-
87
-
 88
88 -
 89
89 -
 90
90 -
 91
91 -
 92
92 -
 93
93 -
 94
94 -
 95
95 -
 96
96 -
 97
97 -
 98
98 -
 99
99 -
 100
100 -
 101
101 -
 102
102 -
 103
103 -
 104
104 -
 105
105 -
 106
106 -
 107
107 -
 108
108 -
109
-
110
-
111
-
112
-
113
-
114
-
115
-
116
-
117
-
118
-
119
-
120
-
121
-
122
-
123
-
124
-
125
-
126
-
127
-
128
-
129
-
130
-
131
-
132
-
133
-
134
-
135
-
136
-
137
-
138
-
139
-
140
-
141
-
142
-
143
-
144
-
145
-
146
-
147
-
148
-
149
-
150
-
151
-
152
-
153
-
154
-
155
-
156
-
157
-
158
-
159
-
160
-
161
-
162
-
163
-
164
-
165
-
166
-
167
-
168
-
169
-
170
-
171
-
172
-
173
-
174
-
175
-
176
 |
 |

76
(2) Tier 1 common equity ratios are non-GAAP measures. BB&T uses the Tier 1 common equity definition used in the
SCAP assessment to calculate these ratios. Management uses these measures to assess the quality of capital and believes
that investors may find them useful in their analysis of the Company. These capital measures are not necessarily
comparable to similar capital measures that may be presented by other companies.
(3) Risk-weighted assets are determined based on regulatory capital requirements.
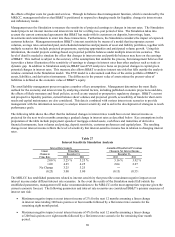
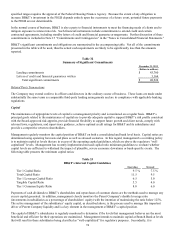
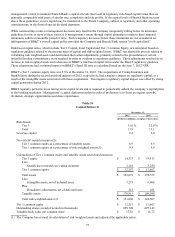
As of December 31, 2012, management currently estimates the Tier 1 common ratio under the currently proposed U.S. Basel
III standards to be 7.9%. The proposed U.S. Basel III standards incorporate changes to the risk-weighting of loans secured
by residential properties, requiring consideration of loan-to-value ratios in determining risk-weighting. Management’ s
estimate of the Tier 1 common ratio under the proposed U.S. Basel III standards does not include any mitigation strategies to
improve capital levels, which management believes will have a significant positive impact on this measure. The following
table presents the calculation of the Tier 1 common equity ratio under the proposed Basel III guidelines.
Table 35
Estimated Basel III Capital Ratio Under Proposed U.S. Rules (1)
December 31, 2012
(Dollars in millions)
Tier 1 common equity under Basel I definition $ 12,257
Adjustments:
OCI related to AFS securities, defined benefit
pension and other postretirement employee benefit plans (385)
Other adjustments (9)
Estimated Tier 1 common equity under proposed Basel III definition $ 11,863
Estimated risk-weighted assets under proposed Basel III definition $ 150,300
Estimated Tier 1 common equity as a percentage of risk-weighted assets under proposed
Basel III definition 7.9 %
(1) The estimated Basel III capital ratio is a non-GAAP measure and reflects adjustments for the related elements as
proposed by regulatory authorities, which are subject to change. BB&T management uses this measure to assess the
quality of capital and believes that investors may find it useful in their analysis of the Company. This capital measure is
not necessarily comparable to similar capital measures that may be presented by other companies.
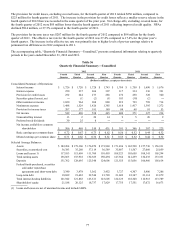
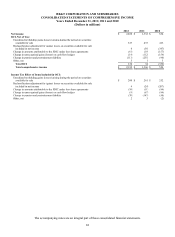
Fourth Quarter Results
Consolidated net income available to common shareholders for the fourth quarter of 2012 totaling $506 million was up
29.4% compared to $391 million earned during the same period in 2011. On a diluted per common share basis, earnings for
the fourth quarter of 2012 were $0.71, up 29.1% compared to $0.55 for the same period in 2011. BB&T’ s results of
operations for the fourth quarter of 2012 produced an annualized return on average assets of 1.20% and an annualized return
on average common shareholders’ equity of 10.51% compared to prior year ratios of 0.93% and 8.76%, respectively.
Total revenues were $2.5 billion for the fourth quarter of 2012, up $122 million compared to the fourth quarter of 2011. The
increase in total revenues included $24 million of higher taxable-equivalent net interest income, which was primarily driven
by a 21.4% decrease in funding costs from the same quarter of the prior year. NIM was 3.84%, down 18 basis points
compared to the fourth quarter of 2011, which reflects covered loan run-off and lower yields on new loans and securities
partially offset by lower funding costs. Noninterest income increased $98 million, primarily attributable to a $108 million
increase in insurance income and a $96 million increase in mortgage banking income, offset by a $103 million decrease in
net securities gains.
Noninterest expenses were $1.5 billion for the fourth quarter of 2012, a decrease of $130 million, or 8.0%, compared to the
fourth quarter of 2011. The decrease in noninterest expenses was primarily due to a $298 million decrease in foreclosed
property expense, which was the result of losses and writedowns in the prior year quarter when management implemented a
more aggressive approach to reduce foreclosed real estate. This decrease was partially offset by a $144 million increase in
personnel expense primarily due to the Crump Insurance and BankAtlantic acquisitions, increased production-related
incentives and commissions and certain other increases in salaries and benefits.