BB&T 2012 Annual Report Download - page 106
Download and view the complete annual report
Please find page 106 of the 2012 BB&T annual report below. You can navigate through the pages in the report by either clicking on the pages listed below, or by using the keyword search tool below to find specific information within the annual report.-
 1
1 -
2
-
3
-
4
-
5
-
6
-
7
-
8
-
9
-
10
-
11
-
12
-
13
-
14
-
15
-
16
-
17
-
18
-
19
-
20
-
21
-
22
-
23
-
24
-
25
-
26
-
27
-
28
-
29
-
30
-
31
-
32
-
33
-
34
-
35
-
36
-
37
-
38
-
39
-
40
-
41
-
42
-
43
-
44
-
45
-
46
-
47
-
48
-
49
-
50
-
51
-
52
-
53
-
54
-
55
-
56
-
57
-
58
-
59
-
60
-
61
-
62
-
63
-
64
-
65
-
66
-
67
-
68
-
69
-
70
-
71
-
72
-
73
-
74
-
75
-
76
-
77
-
78
-
79
-
80
-
81
-
82
-
83
-
84
-
85
-
86
-
87
-
88
-
89
-
90
-
91
-
92
-
93
-
94
-
95
-
 96
96 -
 97
97 -
 98
98 -
 99
99 -
 100
100 -
 101
101 -
 102
102 -
 103
103 -
 104
104 -
 105
105 -
 106
106 -
 107
107 -
 108
108 -
 109
109 -
 110
110 -
 111
111 -
 112
112 -
 113
113 -
 114
114 -
 115
115 -
 116
116 -
117
-
118
-
119
-
120
-
121
-
122
-
123
-
124
-
125
-
126
-
127
-
128
-
129
-
130
-
131
-
132
-
133
-
134
-
135
-
136
-
137
-
138
-
139
-
140
-
141
-
142
-
143
-
144
-
145
-
146
-
147
-
148
-
149
-
150
-
151
-
152
-
153
-
154
-
155
-
156
-
157
-
158
-
159
-
160
-
161
-
162
-
163
-
164
-
165
-
166
-
167
-
168
-
169
-
170
-
171
-
172
-
173
-
174
-
175
-
176
 |
 |

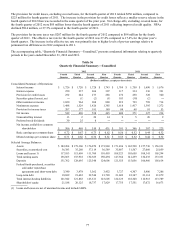
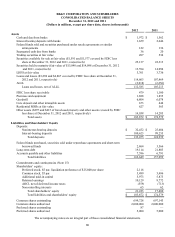
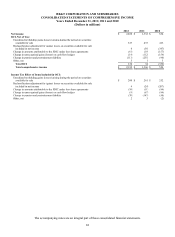
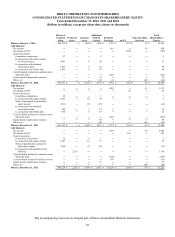
The accompanying notes are an integral part of these consolidated financial statements.
84
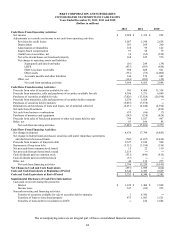
BB&T CORPORATION AND SUBSIDIARIES
CONSOLIDATED STATEMENTS OF CASH FLOWS
Years Ended December 31, 2012, 2011 and 2010
(Dollars in millions)
2012 2011 2010
Cash Flows From Operating Activities:
N
et income $ 2,028 $ 1,332 $ 854
Adjustments to reconcile net income to net cash from operating activities:
Provision for credit losses 1,057 1,190 2,638
Depreciation 281 264 260
Amortization of intangibles 110 99 122
Equity-based compensation 97 98 79
(Gain) loss on securities, net 12 (62) (554)
N
et write-downs/losses on foreclosed property 168 655 576
N
et change in operating assets and liabilities:
Segregated cash due from banks (16) 289 (39)
LHFS (433) (583) (620)
FDIC loss share receivable 590 869 921
Other assets (381) (55) (2,006)
Accounts payable and other liabilities 346 572 689
Other, net (161) (103) (22)
N
et cash from operating activities 3,698 4,565 2,898
Cash Flows From Investing Activities:
Proceeds from sales of securities available for sale 303 4,006 31,334
Proceeds from maturities, calls and paydowns of securities available for sale 4,396 3,271 6,049
Purchases of securities available for sale (7,026) (13,926) (26,598)
Proceeds from maturities, calls and paydowns of securities held to maturity 5,536 1,828 ―
Purchases of securities held to maturity (5,055) (7,578) ―
Originations and purchases of loans and leases, net of principal collected (6,651) (6,240) (4,594)
N
et cash from divestitures ― ― (832)
N
et cash from business combinations 675 (86) (7)
Purchases of premises and equipment (145) (224) (428)
Proceeds from sales of foreclosed property or other real estate held for sale 799 1,017 967
Other, net 83 106 88
N
et cash from investing activities (7,085) (17,826) 5,979
Cash Flows From Financing Activities:
N
et change in deposits 4,676 17,799 (6,843)
N
et change in federal funds purchased, securities sold under repurchase agreements
and short-term borrowed funds (702) (2,107) (2,434)
Proceeds from issuance of long-term debt 2,327 2,010 500
Repayment of long-term debt (5,112) (2,190) (336)
N
et proceeds from common stock issued 15 22 110
N
et proceeds from preferred stock issued 2,116 ― ―
Cash dividends paid on common stock (531) (446) (415)
Cash dividends paid on preferred stock (33) ― ―
Other, net 40 132 277
N
et cash from financing activities 2,796 15,220 (9,141)
Net Change in Cash and Cash Equivalents (591) 1,959 (264)
Cash and Cash Equivalents at Beginning of Period 4,344 2,385 2,649
Cash and Cash Equivalents at End of Period $ 3,753 $ 4,344 $ 2,385
Supplemental Disclosure of Cash Flow Information:
Cash paid (received) during the period for:
Interest $ 1,120 $ 1,404 $ 1,868
Income taxes 347 (82) 972
N
oncash investing and financing activities:
Transfer of securities available for sale to securities held to maturity 1 8,341 ―
Transfers of loans to foreclosed property 473 1,083 1,521
Transfers of loans held for investment to LHFS ― 226 1,604