BB&T 2012 Annual Report Download - page 59
Download and view the complete annual report
Please find page 59 of the 2012 BB&T annual report below. You can navigate through the pages in the report by either clicking on the pages listed below, or by using the keyword search tool below to find specific information within the annual report.-
 1
1 -
2
-
3
-
4
-
5
-
6
-
7
-
8
-
9
-
10
-
11
-
12
-
13
-
14
-
15
-
16
-
17
-
18
-
19
-
20
-
21
-
22
-
23
-
24
-
25
-
26
-
27
-
28
-
29
-
30
-
31
-
32
-
33
-
34
-
35
-
36
-
37
-
38
-
39
-
40
-
41
-
42
-
43
-
44
-
45
-
46
-
47
-
48
-
 49
49 -
 50
50 -
 51
51 -
 52
52 -
 53
53 -
 54
54 -
 55
55 -
 56
56 -
 57
57 -
 58
58 -
 59
59 -
 60
60 -
 61
61 -
 62
62 -
 63
63 -
 64
64 -
 65
65 -
 66
66 -
 67
67 -
 68
68 -
 69
69 -
70
-
71
-
72
-
73
-
74
-
75
-
76
-
77
-
78
-
79
-
80
-
81
-
82
-
83
-
84
-
85
-
86
-
87
-
88
-
89
-
90
-
91
-
92
-
93
-
94
-
95
-
96
-
97
-
98
-
99
-
100
-
101
-
102
-
103
-
104
-
105
-
106
-
107
-
108
-
109
-
110
-
111
-
112
-
113
-
114
-
115
-
116
-
117
-
118
-
119
-
120
-
121
-
122
-
123
-
124
-
125
-
126
-
127
-
128
-
129
-
130
-
131
-
132
-
133
-
134
-
135
-
136
-
137
-
138
-
139
-
140
-
141
-
142
-
143
-
144
-
145
-
146
-
147
-
148
-
149
-
150
-
151
-
152
-
153
-
154
-
155
-
156
-
157
-
158
-
159
-
160
-
161
-
162
-
163
-
164
-
165
-
166
-
167
-
168
-
169
-
170
-
171
-
172
-
173
-
174
-
175
-
176
 |
 |

37
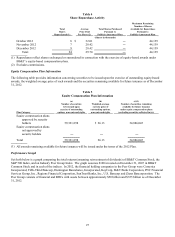
The income statement effect of the above items is offset by the applicable loss share percentage in FDIC loss share
income, net.
The following table provides the carrying amount and estimated fair value of the components of the FDIC loss share
receivable.
Table 6
FDIC Loss Share Receivable
December 31,
2012 2011
Carrying Amount Fair Value Carrying Amount Fair Value
(Dollars in millions)
Covered loans $ 1,107 $ 751 $ 1,532 $ 1,351
Covered securities (553) (502) (396) (354)
Aggregate loss calculation (75) (100) (36) (87)
FDIC loss share receivable $ 479 $ 149 $ 1,100 $ 910
The decrease in the carrying amount attributable to covered loans was due to the receipt of cash from the FDIC and the
negative accretion due to the credit loss improvement partially reduced by the offset to the provision for covered loans. The
change in the carrying amount attributable to covered securities was due to the offsets to the accretion of the discount and the
amount of the increase in fair value of covered securities. The change in the carrying amount attributable to the aggregate
loss calculation is primarily due to accretion of the expected payment, which is included in the “Accretion due to credit loss
improvement” below. The fair values were based upon a discounted cash flow methodology that was consistent with the
acquisition date methodology. The fair value attributable to covered loans and the aggregate loss calculation changes over
time due to the receipt of cash from the FDIC, updated credit loss assumptions and the passage of time. The fair value
attributable to covered securities was based upon the timing and amount that would be payable to the FDIC should they settle
at the current fair value at the conclusion of the loss share agreement.
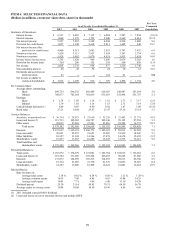
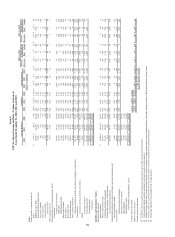
The following table provides information related to the income statement impact of covered loans and securities and the
FDIC loss sharing asset recognized in the Colonial acquisition. The table excludes all amounts related to other assets
acquired and liabilities assumed in the acquisition.
Table 7
Revenue, Net of Provision, Impact from Covered Assets
Years Ended December 31,
2012 2011 2010
(Dollars in millions)
Interest income-covered loans $ 765 $ 1,053 $ 933
Interest income-covered securities 172 168 142
Total interest income 937 1,221 1,075
Provision for covered loans (13) (71) (144)
OTTI for covered securities (4) ― ―
FDIC loss share income, net (318) (289) (116)
Adjusted net revenue $ 602 $ 861 $ 815
FDIC loss share income, net:
Offset to provision for covered loans $ 11 $ 57 $ 115
Accretion due to credit loss improvement (271) (297) (203)
Offset to OTTI for covered securities 3 ― ―
Accretion for securities (61) (49) (28)
Total $ (318) $ (289) $ (116)
2012 compared to 2011
Interest income for 2012 on covered loans and securities acquired in the Colonial acquisition decreased $284 million
compared to 2011, primarily due to lower average covered loan balances. The yield on covered loans for 2012 was 18.91%
compared to 19.15% in 2011. At December 31, 2012, the accretable yield balance on covered loans was $881 million.
Accretable yield represents the excess of expected future cash flows above the current net carrying amount of loans and will
be recognized in income over the remaining life of the covered loans.