BB&T 2012 Annual Report Download - page 71
Download and view the complete annual report
Please find page 71 of the 2012 BB&T annual report below. You can navigate through the pages in the report by either clicking on the pages listed below, or by using the keyword search tool below to find specific information within the annual report.-
 1
1 -
2
-
3
-
4
-
5
-
6
-
7
-
8
-
9
-
10
-
11
-
12
-
13
-
14
-
15
-
16
-
17
-
18
-
19
-
20
-
21
-
22
-
23
-
24
-
25
-
26
-
27
-
28
-
29
-
30
-
31
-
32
-
33
-
34
-
35
-
36
-
37
-
38
-
39
-
40
-
41
-
42
-
43
-
44
-
45
-
46
-
47
-
48
-
49
-
50
-
51
-
52
-
53
-
54
-
55
-
56
-
57
-
58
-
59
-
60
-
 61
61 -
 62
62 -
 63
63 -
 64
64 -
 65
65 -
 66
66 -
 67
67 -
 68
68 -
 69
69 -
 70
70 -
 71
71 -
 72
72 -
 73
73 -
 74
74 -
 75
75 -
 76
76 -
 77
77 -
 78
78 -
 79
79 -
 80
80 -
 81
81 -
82
-
83
-
84
-
85
-
86
-
87
-
88
-
89
-
90
-
91
-
92
-
93
-
94
-
95
-
96
-
97
-
98
-
99
-
100
-
101
-
102
-
103
-
104
-
105
-
106
-
107
-
108
-
109
-
110
-
111
-
112
-
113
-
114
-
115
-
116
-
117
-
118
-
119
-
120
-
121
-
122
-
123
-
124
-
125
-
126
-
127
-
128
-
129
-
130
-
131
-
132
-
133
-
134
-
135
-
136
-
137
-
138
-
139
-
140
-
141
-
142
-
143
-
144
-
145
-
146
-
147
-
148
-
149
-
150
-
151
-
152
-
153
-
154
-
155
-
156
-
157
-
158
-
159
-
160
-
161
-
162
-
163
-
164
-
165
-
166
-
167
-
168
-
169
-
170
-
171
-
172
-
173
-
174
-
175
-
176
 |
 |

49
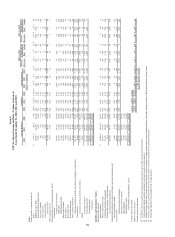
Segment net interest income totaled $465 million in 2011, an increase of $58 million, or 14.3%, compared to 2010. The
growth in segment net interest income in 2011 was driven by strong loan growth in Sheffield Financial as the result of dealer
volume growth and expanded dealer relationships, as well as higher NIM for Lendmark and Governmental Finance. Average
loans for Specialized Lending grew by $1.3 billion, or 11.2%, to $12.8 billion in 2011 compared to 2010.
The allocated provision for loan and lease losses totaled $72 million in 2011, a decrease of $38 million, or 34.5%, compared
to 2010. The decline in the provision for 2011 was primarily attributable to generally improved credit performance across the
lines of business. Due to the overall higher credit risk profiles of some of Specialized Lending’ s clients, loss rates are
expected to be higher than conventional bank lending. Loss rates are also affected by shifts in the portfolio mix of the
underlying subsidiaries.
Noninterest income totaled $211 million in 2011, an increase of $35 million, or 19.9%, compared to 2010. Noninterest
income growth in 2011 was driven by Grandbridge, which achieved record commercial mortgage loan origination volume for
delivery to the secondary market.
Noninterest expense totaled $233 million in 2011, an increase of $15 million, or 6.9%, compared to 2010. The increase in
noninterest expense was driven by personnel expenses related to growth in commercial mortgage lending activities.
Insurance Services
Net income from Insurance Services was $101 million in 2011, down $2 million, or 1.9%, compared to 2010. Insurance
Services was impacted by the weak economy and soft insurance premium pricing, resulting in low commission revenue
growth and pressure on brokerage operating margins.
Noninterest income produced by Insurance Services totaled $1.0 billion during both 2011 and 2010. Revenue generated by
acquisitions was offset by weaker pricing.
Noninterest expenses incurred within the Insurance Services segment increased $12 million, or 1.6%, in 2011 compared to
2010. This increase was due to higher operating costs, including increased legal costs compared to 2010.
Financial Services
Net income from Financial Services increased by $39 million, or 16.7%, to $273 million in 2011, compared to 2010.
Segment net interest income totaled $374 million in 2011, an increase of $60 million, or 19.1%, compared to 2010. The
increase in segment net interest income during 2011 was attributable to strong organic loan and deposit growth in Corporate
Banking, offset by a lower NIM.
The allocated provision for loan and lease losses declined $46 million, or 102.2%, to a $1 million benefit in 2011, reflecting
lower reserve rates for commercial and industrial loans with the continued excellent credit quality performance.
Noninterest income in Financial Services totaled $694 million in 2011, up $37 million, or 5.6%, compared to $657 million
earned during 2010. This increase is primarily attributable to strong BB&T Capital Partners revenue growth related to
maturing investments in its private equity and mezzanine funds. Additionally, Retirement and Institutional Services had
strong noninterest income growth in 2011, with assets growing as the result of improved market conditions and business
initiatives.
Noninterest expense of $574 million incurred by Financial Services increased $47 million, or 8.9%, in 2011. The increase in
noninterest expense in 2011 was impacted by the continued efforts to expand the sales force in Corporate Banking and
BB&T Wealth.
Other, Treasury & Corporate
In 2011, the Other, Treasury & Corporate segment generated a $7 million net loss, compared to net income of $165 million
for the prior year. The decrease in net income was primarily due to a $634 decrease in noninterest income, driven by
securities gains recognized in 2010. The decrease in noninterest income was partially offset by a $197 million increase in
segment net interest income, primarily due to a decrease in FTP funding credits on deposits allocated to the Community
Banking segment. The overall decrease in FTP credits was partially offset by lower yields on the investment portfolio. In
addition, the income tax benefit was $196 million higher than in the prior year.