BB&T 2012 Annual Report Download - page 145
Download and view the complete annual report
Please find page 145 of the 2012 BB&T annual report below. You can navigate through the pages in the report by either clicking on the pages listed below, or by using the keyword search tool below to find specific information within the annual report.-
 1
1 -
2
-
3
-
4
-
5
-
6
-
7
-
8
-
9
-
10
-
11
-
12
-
13
-
14
-
15
-
16
-
17
-
18
-
19
-
20
-
21
-
22
-
23
-
24
-
25
-
26
-
27
-
28
-
29
-
30
-
31
-
32
-
33
-
34
-
35
-
36
-
37
-
38
-
39
-
40
-
41
-
42
-
43
-
44
-
45
-
46
-
47
-
48
-
49
-
50
-
51
-
52
-
53
-
54
-
55
-
56
-
57
-
58
-
59
-
60
-
61
-
62
-
63
-
64
-
65
-
66
-
67
-
68
-
69
-
70
-
71
-
72
-
73
-
74
-
75
-
76
-
77
-
78
-
79
-
80
-
81
-
82
-
83
-
84
-
85
-
86
-
87
-
88
-
89
-
90
-
91
-
92
-
93
-
94
-
95
-
96
-
97
-
98
-
99
-
100
-
101
-
102
-
103
-
104
-
105
-
106
-
107
-
108
-
109
-
110
-
111
-
112
-
113
-
114
-
115
-
116
-
117
-
118
-
119
-
120
-
121
-
122
-
123
-
124
-
125
-
126
-
127
-
128
-
129
-
130
-
131
-
132
-
133
-
134
-
 135
135 -
 136
136 -
 137
137 -
 138
138 -
 139
139 -
 140
140 -
 141
141 -
 142
142 -
 143
143 -
 144
144 -
 145
145 -
 146
146 -
 147
147 -
 148
148 -
 149
149 -
 150
150 -
 151
151 -
 152
152 -
 153
153 -
 154
154 -
 155
155 -
156
-
157
-
158
-
159
-
160
-
161
-
162
-
163
-
164
-
165
-
166
-
167
-
168
-
169
-
170
-
171
-
172
-
173
-
174
-
175
-
176
 |
 |

123
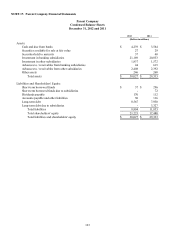
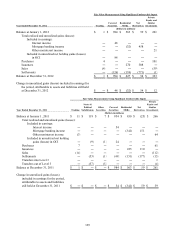
NOTE 17. Parent Company Financial Statements
Parent Company
Condensed Balance Sheets
December 31, 2012 and 2011
2012 2011
(Dollars in millions)
Assets:
Cash and due from banks $ 4,239 $ 3,564
Securities available for sale at fair value 27 29
Securities held to maturity 37 40
Investment in banking subsidiaries 21,189 20,853
Investment in other subsidiaries 1,837 1,572
Advances to / receivables from banking subsidiaries 44 615
Advances to / receivables from other subsidiaries 2,408 2,392
Other assets 246 268
Total assets $ 30,027 $ 29,333
Liabilities and Shareholders' Equity:
Short-term borrowed funds $ 37 $ 296
Short-term borrowed funds due to subsidiaries - 72
Dividends payable 170 112
Accounts payable and other liabilities 30 116
Long-term debt 8,567 7,930
Long-term debt due to subsidiaries - 3,327
Total liabilities 8,804 11,853
Total shareholders' equity 21,223 17,480
Total liabilities and shareholders' equity $ 30,027 $ 29,333