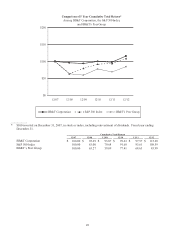
BB&T 2012 Annual Report Download - page 51
Download and view the complete annual report
Please find page 51 of the 2012 BB&T annual report below. You can navigate through the pages in the report by either clicking on the pages listed below, or by using the keyword search tool below to find specific information within the annual report.-
 1
1 -
2
-
3
-
4
-
5
-
6
-
7
-
8
-
9
-
10
-
11
-
12
-
13
-
14
-
15
-
16
-
17
-
18
-
19
-
20
-
21
-
22
-
23
-
24
-
25
-
26
-
27
-
28
-
29
-
30
-
31
-
32
-
33
-
34
-
35
-
36
-
37
-
38
-
39
-
40
-
 41
41 -
 42
42 -
 43
43 -
 44
44 -
 45
45 -
 46
46 -
 47
47 -
 48
48 -
 49
49 -
 50
50 -
 51
51 -
 52
52 -
 53
53 -
 54
54 -
 55
55 -
 56
56 -
 57
57 -
 58
58 -
 59
59 -
 60
60 -
 61
61 -
62
-
63
-
64
-
65
-
66
-
67
-
68
-
69
-
70
-
71
-
72
-
73
-
74
-
75
-
76
-
77
-
78
-
79
-
80
-
81
-
82
-
83
-
84
-
85
-
86
-
87
-
88
-
89
-
90
-
91
-
92
-
93
-
94
-
95
-
96
-
97
-
98
-
99
-
100
-
101
-
102
-
103
-
104
-
105
-
106
-
107
-
108
-
109
-
110
-
111
-
112
-
113
-
114
-
115
-
116
-
117
-
118
-
119
-
120
-
121
-
122
-
123
-
124
-
125
-
126
-
127
-
128
-
129
-
130
-
131
-
132
-
133
-
134
-
135
-
136
-
137
-
138
-
139
-
140
-
141
-
142
-
143
-
144
-
145
-
146
-
147
-
148
-
149
-
150
-
151
-
152
-
153
-
154
-
155
-
156
-
157
-
158
-
159
-
160
-
161
-
162
-
163
-
164
-
165
-
166
-
167
-
168
-
169
-
170
-
171
-
172
-
173
-
174
-
175
-
176
 |
 |

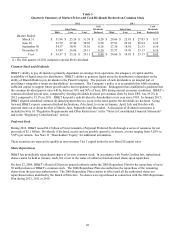
29
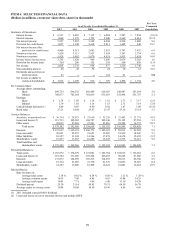
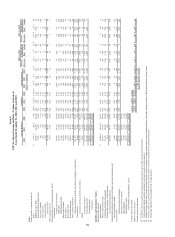
ITEM 6. SELECTED FINANCIAL DATA
(Dollars in millions, except per share data, shares in thousands)
Five Year
As of/ For the Years Ended December 31, Compound
2012 2011 2010 2009 2008 2007 Growth Rate
Summary of Operations:
Interest income $ 6,917 $ 6,885 $ 7,115 $ 6,884 $ 7,207 $ 7,894 (2.6)%
Interest expense 1,060 1,378 1,795 2,040 2,969 4,014 (23.4)
N
et interest income 5,857 5,507 5,320 4,844 4,238 3,880 8.6
Provision for credit losses 1,057 1,190 2,638 2,811 1,445 448 18.7
N
et interest income afte
r
provision for credit losses 4,800 4,317 2,682 2,033 2,793 3,432 6.9
N
oninterest income 3,820 3,113 3,957 3,934 3,197 2,774 6.6
N
oninterest expense 5,828 5,802 5,670 4,931 3,911 3,624 10.0
Income before income taxes 2,792 1,628 969 1,036 2,079 2,582 1.6
Provision for income taxes 764 296 115 159 550 836 (1.8)
N
et income 2,028 1,332 854 877 1,529 1,746 3.0
N
oncontrolling interest 49 43 38 24 10 12 32.5
Dividends and accretion on
preferred stock 63 ― ― 124 21 ― NM
N
et income available to
common shareholders $ 1,916 $ 1,289 $ 816 $ 729 $ 1,498 $ 1,734 2.0
Per Common Share:
Average shares outstanding:
Basic 698,739 696,532 692,489 629,583 548,847 547,184 5.0
Diluted 708,877 705,168 701,039 635,619 552,498 551,755 5.1
Earnings:
Basic $ 2.74 $ 1.85 $ 1.18 $ 1.16 $ 2.73 $ 3.17 (2.9)
Diluted 2.70 1.83 1.16 1.15 2.71 3.14 (3.0)
Cash dividends declared (1) 0.80 0.65 0.60 0.92 1.87 1.80 (15.0)
Book value 27.21 24.98 23.67 23.47 23.16 23.14 3.3
Average Balances:
Securities, at amortized cost $ 36,334 $ 29,923 $ 27,610 $ 31,226 $ 23,402 $ 21,731 10.8
Loans and leases (2) 113,733 105,962 104,787 102,146 95,195 87,952 5.3
Other assets 28,035 27,081 27,261 21,810 18,284 16,737 10.9
Total assets $ 178,102 $ 162,966 $ 159,658 $ 155,182 $ 136,881 $ 126,420 7.1
Deposits $ 127,617 $ 112,318 $ 106,773 $ 102,381 $ 88,831 $ 83,501 8.9
Long-term debt 20,651 22,257 21,653 19,085 19,839 18,045 2.7
Other liabilities 10,357 11,124 14,346 17,478 14,678 12,659 (3.9)
Shareholders' equity 19,477 17,267 16,886 16,238 13,533 12,215 9.8
Total liabilities and
shareholders' equity $ 178,102 $ 162,966 $ 159,658 $ 155,182 $ 136,881 $ 126,420 7.1
Period-End Balances:
Total assets $ 183,872 $ 174,579 $ 157,081 $ 165,764 $ 152,015 $ 132,618 6.8
Loans and leases (2) 118,364 111,205 107,264 106,207 98,669 91,686 5.2
Deposits 133,075 124,939 107,213 114,965 98,613 86,766 8.9
Long-term debt 19,114 21,803 21,730 21,376 18,032 18,693 0.4
Shareholders' equity 21,223 17,480 16,498 16,241 16,081 12,664 10.9
Selected Ratios:
Rate of return on:
Average total assets 1.14 % 0.82 % 0.54 % 0.56 % 1.12 % 1.38 %
Average common equity 10.35 7.49 4.85 4.93 11.44 14.25
Average total equity 10.41 7.71 5.06 5.40 11.30 14.30
Dividend payout 29.20 35.14 50.85 79.31 68.50 56.78
Average equity to average assets 10.94 10.60 10.58 10.46 9.89 9.66
(1) 2011 included a special $0.01 dividend.
(2) Loans and leases are net of unearned income and include LHFS.