BB&T 2012 Annual Report Download - page 83
Download and view the complete annual report
Please find page 83 of the 2012 BB&T annual report below. You can navigate through the pages in the report by either clicking on the pages listed below, or by using the keyword search tool below to find specific information within the annual report.-
 1
1 -
2
-
3
-
4
-
5
-
6
-
7
-
8
-
9
-
10
-
11
-
12
-
13
-
14
-
15
-
16
-
17
-
18
-
19
-
20
-
21
-
22
-
23
-
24
-
25
-
26
-
27
-
28
-
29
-
30
-
31
-
32
-
33
-
34
-
35
-
36
-
37
-
38
-
39
-
40
-
41
-
42
-
43
-
44
-
45
-
46
-
47
-
48
-
49
-
50
-
51
-
52
-
53
-
54
-
55
-
56
-
57
-
58
-
59
-
60
-
61
-
62
-
63
-
64
-
65
-
66
-
67
-
68
-
69
-
70
-
71
-
72
-
 73
73 -
 74
74 -
 75
75 -
 76
76 -
 77
77 -
 78
78 -
 79
79 -
 80
80 -
 81
81 -
 82
82 -
 83
83 -
 84
84 -
 85
85 -
 86
86 -
 87
87 -
 88
88 -
 89
89 -
 90
90 -
 91
91 -
 92
92 -
 93
93 -
94
-
95
-
96
-
97
-
98
-
99
-
100
-
101
-
102
-
103
-
104
-
105
-
106
-
107
-
108
-
109
-
110
-
111
-
112
-
113
-
114
-
115
-
116
-
117
-
118
-
119
-
120
-
121
-
122
-
123
-
124
-
125
-
126
-
127
-
128
-
129
-
130
-
131
-
132
-
133
-
134
-
135
-
136
-
137
-
138
-
139
-
140
-
141
-
142
-
143
-
144
-
145
-
146
-
147
-
148
-
149
-
150
-
151
-
152
-
153
-
154
-
155
-
156
-
157
-
158
-
159
-
160
-
161
-
162
-
163
-
164
-
165
-
166
-
167
-
168
-
169
-
170
-
171
-
172
-
173
-
174
-
175
-
176
 |
 |

61
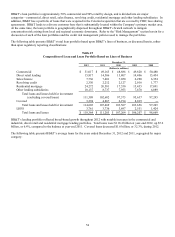
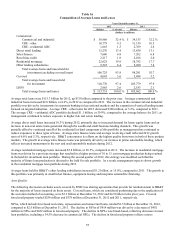
Refer to Note 4 “Allowance for Credit Losses” in the “Notes to Consolidated Financial Statements” for additional
disclosures.
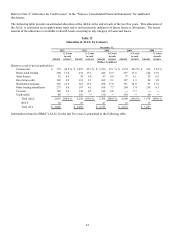
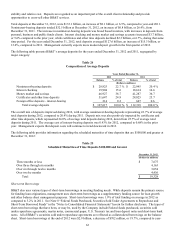
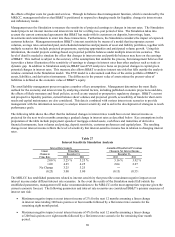
The following table presents an estimated allocation of the ALLL at the end of each of the last five years. This allocation of
the ALLL is calculated on an approximate basis and is not necessarily indicative of future losses or allocations. The entire
amount of the allowance is available to absorb losses occurring in any category of loans and leases.
Table 22
Allocation of ALLL by Category
December 31,
2012 2011 2010 2009 2008
% Loans % Loans % Loans % Loans % Loans
in each in each in each in each in each
Amount category Amount category Amount category Amount category Amount category
(Dollars in millions)
Balances at end of period applicable to:
Commercial $ 774 44.5 % $ 1,053 45.7 % $ 1,536 47.1 % $ 1,574 48.2 % $ 912 51.9 %
Direct retail lending 300 13.8 232 13.5 246 13.3 297 13.8 124 15.9
Sales finance 29 6.8 38 6.9 47 6.8 77 6.1 55 6.5
Revolving credit 102 2.0 112 2.1 109 2.1 127 1.9 94 1.8
Residential mortgage 328 21.2 365 19.2 298 17.0 131 14.9 91 17.6
Other lending subsidiaries 277 8.8 197 8.1 198 7.7 264 7.4 238 6.3
Covered 128 2.9 149 4.5 144 6.0 ― 7.7 ― ―
Unallocated 80 ― 110 ― 130 ― 130 ― 60 ―
Total ALLL 2,018 100.0 % 2,256 100.0 % 2,708 100.0 % 2,600 100.0 % 1,574 100.0 %
RUFC 30 29 47 72 33
Total ACL $ 2,048 $ 2,285 $ 2,755 $ 2,672 $ 1,607
Information related to BB&T’ s ALLL for the last five years is presented in the following table.