BB&T 2012 Annual Report Download - page 60
Download and view the complete annual report
Please find page 60 of the 2012 BB&T annual report below. You can navigate through the pages in the report by either clicking on the pages listed below, or by using the keyword search tool below to find specific information within the annual report.-
 1
1 -
2
-
3
-
4
-
5
-
6
-
7
-
8
-
9
-
10
-
11
-
12
-
13
-
14
-
15
-
16
-
17
-
18
-
19
-
20
-
21
-
22
-
23
-
24
-
25
-
26
-
27
-
28
-
29
-
30
-
31
-
32
-
33
-
34
-
35
-
36
-
37
-
38
-
39
-
40
-
41
-
42
-
43
-
44
-
45
-
46
-
47
-
48
-
49
-
 50
50 -
 51
51 -
 52
52 -
 53
53 -
 54
54 -
 55
55 -
 56
56 -
 57
57 -
 58
58 -
 59
59 -
 60
60 -
 61
61 -
 62
62 -
 63
63 -
 64
64 -
 65
65 -
 66
66 -
 67
67 -
 68
68 -
 69
69 -
 70
70 -
71
-
72
-
73
-
74
-
75
-
76
-
77
-
78
-
79
-
80
-
81
-
82
-
83
-
84
-
85
-
86
-
87
-
88
-
89
-
90
-
91
-
92
-
93
-
94
-
95
-
96
-
97
-
98
-
99
-
100
-
101
-
102
-
103
-
104
-
105
-
106
-
107
-
108
-
109
-
110
-
111
-
112
-
113
-
114
-
115
-
116
-
117
-
118
-
119
-
120
-
121
-
122
-
123
-
124
-
125
-
126
-
127
-
128
-
129
-
130
-
131
-
132
-
133
-
134
-
135
-
136
-
137
-
138
-
139
-
140
-
141
-
142
-
143
-
144
-
145
-
146
-
147
-
148
-
149
-
150
-
151
-
152
-
153
-
154
-
155
-
156
-
157
-
158
-
159
-
160
-
161
-
162
-
163
-
164
-
165
-
166
-
167
-
168
-
169
-
170
-
171
-
172
-
173
-
174
-
175
-
176
 |
 |

38
During 2012, BB&T reduced the accretable yield balance on covered loans by $72 million primarily due to changes in the
expected lives of the underlying loans. During 2011, BB&T reclassified $379 million from the nonaccretable balance to
accretable yield on covered loans. This reclassification was primarily the result of increased cash flow estimates resulting
from improved loss expectations. These adjustments are recognized on a prospective basis over the remaining lives of the
loan pools.
The provision for covered loans was $13 million in 2012, a decrease of $58 million compared to 2011. This decrease
resulted from the quarterly reassessment process.
FDIC loss share income, net was $29 million worse than 2011 primarily due to a lower offset to the provision for covered
loans.
2011 compared to 2010
Interest income for 2011 on covered loans and securities acquired in the Colonial acquisition increased $146 million
compared to 2010, which was offset by a decrease in FDIC loss share income. The majority of the increase is related to loans
and reflects higher expected cash flows based on the quarterly cash flow reassessment process. The yield on covered loans
for 2011 was 19.15% compared to 13.22% in 2010. At December 31, 2011, the accretable yield balance on these loans was
$1.7 billion. Accretable yield represents the excess of future cash flows above the current net carrying amount of loans and
will be recognized into income over the remaining life of the covered and acquired loans. The increase in interest income on
securities compared to the prior year was primarily a result of security duration adjustments in the prior year, which is offset
in FDIC loss share income.
During 2011 and 2010, BB&T reclassified $379 million and $1.2 billion, respectively, from the nonaccretable balance to
accretable yield on covered loans. These reclassifications were primarily the result of increased cash flow estimates resulting
from improved loss expectations. These amounts are recognized as prospective yield adjustments and result in increased
interest income over the remaining lives of the loan pools.
The provision for covered loans was $71 million in 2011, a decrease of $73 million compared to 2010. The provision
expenses recorded during 2011 and 2010 resulted from the quarterly reassessment process, which showed decreases in
expected cash flows in certain loan pools that were partially offset by recoveries in other previously impaired loan pools.
FDIC loss share income, net decreased $173 million compared to 2010 primarily due to the impact of cash flow
reassessments that generated additional interest income and a reduction of amounts due from the FDIC as a result of
decreased loss projections on covered loans.
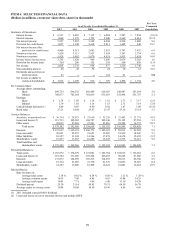
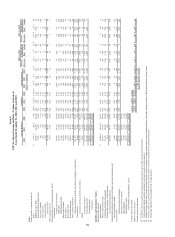
FTE Net Interest Income and Rate / Volume Analysis
The following table sets forth the major components of net interest income and the related yields and rates for 2012, 2011 and
2010, as well as the variances between the periods caused by changes in interest rates versus changes in volumes. Changes
attributable to the mix of assets and liabilities have been allocated proportionally between the changes due to rate and the
changes due to volume.