BB&T 2012 Annual Report Download - page 139
Download and view the complete annual report
Please find page 139 of the 2012 BB&T annual report below. You can navigate through the pages in the report by either clicking on the pages listed below, or by using the keyword search tool below to find specific information within the annual report.-
 1
1 -
2
-
3
-
4
-
5
-
6
-
7
-
8
-
9
-
10
-
11
-
12
-
13
-
14
-
15
-
16
-
17
-
18
-
19
-
20
-
21
-
22
-
23
-
24
-
25
-
26
-
27
-
28
-
29
-
30
-
31
-
32
-
33
-
34
-
35
-
36
-
37
-
38
-
39
-
40
-
41
-
42
-
43
-
44
-
45
-
46
-
47
-
48
-
49
-
50
-
51
-
52
-
53
-
54
-
55
-
56
-
57
-
58
-
59
-
60
-
61
-
62
-
63
-
64
-
65
-
66
-
67
-
68
-
69
-
70
-
71
-
72
-
73
-
74
-
75
-
76
-
77
-
78
-
79
-
80
-
81
-
82
-
83
-
84
-
85
-
86
-
87
-
88
-
89
-
90
-
91
-
92
-
93
-
94
-
95
-
96
-
97
-
98
-
99
-
100
-
101
-
102
-
103
-
104
-
105
-
106
-
107
-
108
-
109
-
110
-
111
-
112
-
113
-
114
-
115
-
116
-
117
-
118
-
119
-
120
-
121
-
122
-
123
-
124
-
125
-
126
-
127
-
128
-
 129
129 -
 130
130 -
 131
131 -
 132
132 -
 133
133 -
 134
134 -
 135
135 -
 136
136 -
 137
137 -
 138
138 -
 139
139 -
 140
140 -
 141
141 -
 142
142 -
 143
143 -
 144
144 -
 145
145 -
 146
146 -
 147
147 -
 148
148 -
 149
149 -
150
-
151
-
152
-
153
-
154
-
155
-
156
-
157
-
158
-
159
-
160
-
161
-
162
-
163
-
164
-
165
-
166
-
167
-
168
-
169
-
170
-
171
-
172
-
173
-
174
-
175
-
176
 |
 |

117
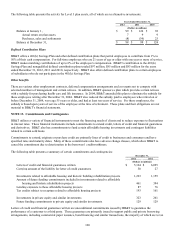
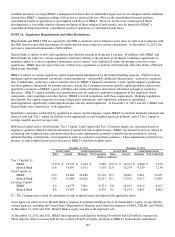
NOTE 14. Benefit Plans
Defined Benefit Retirement Plans
BB&T provides a defined benefit retirement plan qualified under the Internal Revenue Code that covers most employees.
Benefits are based on years of service, age at retirement and the employee's compensation during the five highest consecutive
years of earnings within the last ten years of employment.
In addition, supplemental retirement benefits are provided to certain key officers under supplemental defined benefit
executive retirement plans, which are not qualified under the Internal Revenue Code. Although technically unfunded plans, a
Rabbi Trust and insurance policies on the lives of the certain covered employees are available to finance future benefits.
The following are the significant actuarial assumptions that were used to determine net periodic pension costs for the
qualified pension plan:
December 31,
2012 2011 2010
Weighted average assumed discount rate 4.82 % 5.52 % 6.16 %
Weighted average expected long-term rate of return on plan assets 8.00 8.00 8.00
Assumed long-term rate of annual compensation increases (1) 4.50 4.50 4.50
(1) Represents the rate to be achieved by 2015.
The weighted average expected long-term rate of return on plan assets represents the average rate of return expected to be
earned on plan assets over the period the benefits included in the benefit obligation are to be paid. In developing the expected
rate of return, BB&T considers long-term compound annualized returns of historical market data for each asset category, as
well as historical actual returns on the plan assets. Using this reference information, the Company develops forward-looking
return expectations for each asset category and a weighted average expected long-term rate of return for the plan based on
target asset allocations contained in BB&T's Investment Policy Statement.
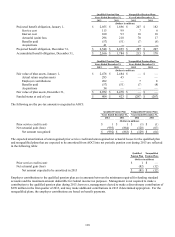
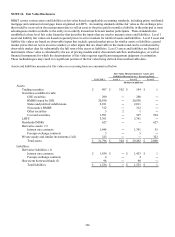
Financial data relative to the defined benefit pension plans is summarized in the following tables for the years indicated. The
qualified pension plan prepaid asset is recorded on the Consolidated Balance Sheets as a component of other assets and the
nonqualified pension plans accrued liability is recorded on the Consolidated Balance Sheets as a component of other
liabilities. The data is calculated using an actuarial measurement date of December 31.
Years Ended December 31,
2012 2011 2010
(Dollars in millions)
N
et Periodic Pension Cost:
Service cost $ 120 $ 105 $ 83
Interest cost 110 103 93
Estimated return on plan assets (200) (197) (178)
N
et amortization and othe
r
76 34 24
N
et periodic benefit cost 106 45 22
Pre-Tax Amounts Recognized in Total Comprehensive Income:
N
et actuarial loss (gain) 270 388 133
N
et amortization (76) (34) (24)
N
et amount recognized in OCI 194 354 109
Total net periodic pension costs (income) recognized in
total comprehensive income, pre-tax $ 300 $ 399 $ 131
The following are the significant actuarial assumptions that were used to determine benefit obligations:
December 31,
2012 2011
Weighted average assumed discount rate 4.25 % 4.82 %
Assumed rate of annual compensation increases (1) 4.50 4.50
(1) Represents the rate to be achieved by 2015.