BB&T 2012 Annual Report Download - page 116
Download and view the complete annual report
Please find page 116 of the 2012 BB&T annual report below. You can navigate through the pages in the report by either clicking on the pages listed below, or by using the keyword search tool below to find specific information within the annual report.-
 1
1 -
2
-
3
-
4
-
5
-
6
-
7
-
8
-
9
-
10
-
11
-
12
-
13
-
14
-
15
-
16
-
17
-
18
-
19
-
20
-
21
-
22
-
23
-
24
-
25
-
26
-
27
-
28
-
29
-
30
-
31
-
32
-
33
-
34
-
35
-
36
-
37
-
38
-
39
-
40
-
41
-
42
-
43
-
44
-
45
-
46
-
47
-
48
-
49
-
50
-
51
-
52
-
53
-
54
-
55
-
56
-
57
-
58
-
59
-
60
-
61
-
62
-
63
-
64
-
65
-
66
-
67
-
68
-
69
-
70
-
71
-
72
-
73
-
74
-
75
-
76
-
77
-
78
-
79
-
80
-
81
-
82
-
83
-
84
-
85
-
86
-
87
-
88
-
89
-
90
-
91
-
92
-
93
-
94
-
95
-
96
-
97
-
98
-
99
-
100
-
101
-
102
-
103
-
104
-
105
-
 106
106 -
 107
107 -
 108
108 -
 109
109 -
 110
110 -
 111
111 -
 112
112 -
 113
113 -
 114
114 -
 115
115 -
 116
116 -
 117
117 -
 118
118 -
 119
119 -
 120
120 -
 121
121 -
 122
122 -
 123
123 -
 124
124 -
 125
125 -
 126
126 -
127
-
128
-
129
-
130
-
131
-
132
-
133
-
134
-
135
-
136
-
137
-
138
-
139
-
140
-
141
-
142
-
143
-
144
-
145
-
146
-
147
-
148
-
149
-
150
-
151
-
152
-
153
-
154
-
155
-
156
-
157
-
158
-
159
-
160
-
161
-
162
-
163
-
164
-
165
-
166
-
167
-
168
-
169
-
170
-
171
-
172
-
173
-
174
-
175
-
176
 |
 |

94
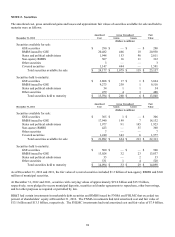
NOTE 2. Securities
The amortized cost, gross unrealized gains and losses and approximate fair values of securities available for sale and held to
maturity were as follows:
Amortized Gross Unrealized Fair
December 31, 2012 Cost Gains Losses Value
(Dollars in millions)
Securities available for sale:
GSE securities $ 290 $ — $ — $ 290
RMBS issued by GSE 20,482 466 18 20,930
States and political subdivisions 1,948 153 90 2,011
N
on-agency RMBS 307 16 11 312
Other securities 3 — — 3
Covered securities 1,147 444 — 1,591
Total securities available for sale $ 24,177 $ 1,079 $ 119 $ 25,137
Securities held to maturity:
GSE securities $ 3,808 $ 17 $ 1 $ 3,824
RMBS issued by GSE 9,273 238 1 9,510
States and political subdivisions 34 1 1 34
Other securities 479 4 3 480
Total securities held to maturity $ 13,594 $ 260 $ 6 $ 13,848
Amortized Gross Unrealized Fair
December 31, 2011 Cost Gains Losses Value
(Dollars in millions)
Securities available for sale:
GSE securities $ 305 $ 1 $ — $ 306
RMBS issued by GSE 17,940 199 7 18,132
States and political subdivisions 1,977 91 145 1,923
N
on-agency RMBS 423 — 55 368
Other securities 7 — — 7
Covered securities 1,240 343 6 1,577
Total securities available for sale $ 21,892 $ 634 $ 213 $ 22,313
Securities held to maturity:
GSE securities $ 500 $ — $ — $ 500
RMBS issued by GSE 13,028 32 23 13,037
States and political subdivisions 35 — 2 33
Other securities 531 1 4 528
Total securities held to maturity $ 14,094 $ 33 $ 29 $ 14,098
As of December 31, 2012 and 2011, the fair value of covered securities included $1.3 billion of non-agency RMBS and $326
million of municipal securities.
At December 31, 2012 and 2011, securities with carrying values of approximately $19.0 billion and $15.5 billion,
respectively, were pledged to secure municipal deposits, securities sold under agreements to repurchase, other borrowings,
and for other purposes as required or permitted by law.
BB&T had certain investments in marketable debt securities and RMBS issued by FNMA and FHLMC that exceeded ten
percent of shareholders’ equity at December 31, 2012. The FNMA investments had total amortized cost and fair value of
$13.1 billion and $13.3 billion, respectively. The FHLMC investments had total amortized cost and fair value of $7.9 billion.