BB&T 2012 Annual Report Download - page 117
Download and view the complete annual report
Please find page 117 of the 2012 BB&T annual report below. You can navigate through the pages in the report by either clicking on the pages listed below, or by using the keyword search tool below to find specific information within the annual report.-
 1
1 -
2
-
3
-
4
-
5
-
6
-
7
-
8
-
9
-
10
-
11
-
12
-
13
-
14
-
15
-
16
-
17
-
18
-
19
-
20
-
21
-
22
-
23
-
24
-
25
-
26
-
27
-
28
-
29
-
30
-
31
-
32
-
33
-
34
-
35
-
36
-
37
-
38
-
39
-
40
-
41
-
42
-
43
-
44
-
45
-
46
-
47
-
48
-
49
-
50
-
51
-
52
-
53
-
54
-
55
-
56
-
57
-
58
-
59
-
60
-
61
-
62
-
63
-
64
-
65
-
66
-
67
-
68
-
69
-
70
-
71
-
72
-
73
-
74
-
75
-
76
-
77
-
78
-
79
-
80
-
81
-
82
-
83
-
84
-
85
-
86
-
87
-
88
-
89
-
90
-
91
-
92
-
93
-
94
-
95
-
96
-
97
-
98
-
99
-
100
-
101
-
102
-
103
-
104
-
105
-
106
-
 107
107 -
 108
108 -
 109
109 -
 110
110 -
 111
111 -
 112
112 -
 113
113 -
 114
114 -
 115
115 -
 116
116 -
 117
117 -
 118
118 -
 119
119 -
 120
120 -
 121
121 -
 122
122 -
 123
123 -
 124
124 -
 125
125 -
 126
126 -
 127
127 -
128
-
129
-
130
-
131
-
132
-
133
-
134
-
135
-
136
-
137
-
138
-
139
-
140
-
141
-
142
-
143
-
144
-
145
-
146
-
147
-
148
-
149
-
150
-
151
-
152
-
153
-
154
-
155
-
156
-
157
-
158
-
159
-
160
-
161
-
162
-
163
-
164
-
165
-
166
-
167
-
168
-
169
-
170
-
171
-
172
-
173
-
174
-
175
-
176
 |
 |
95
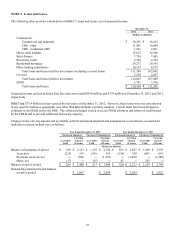
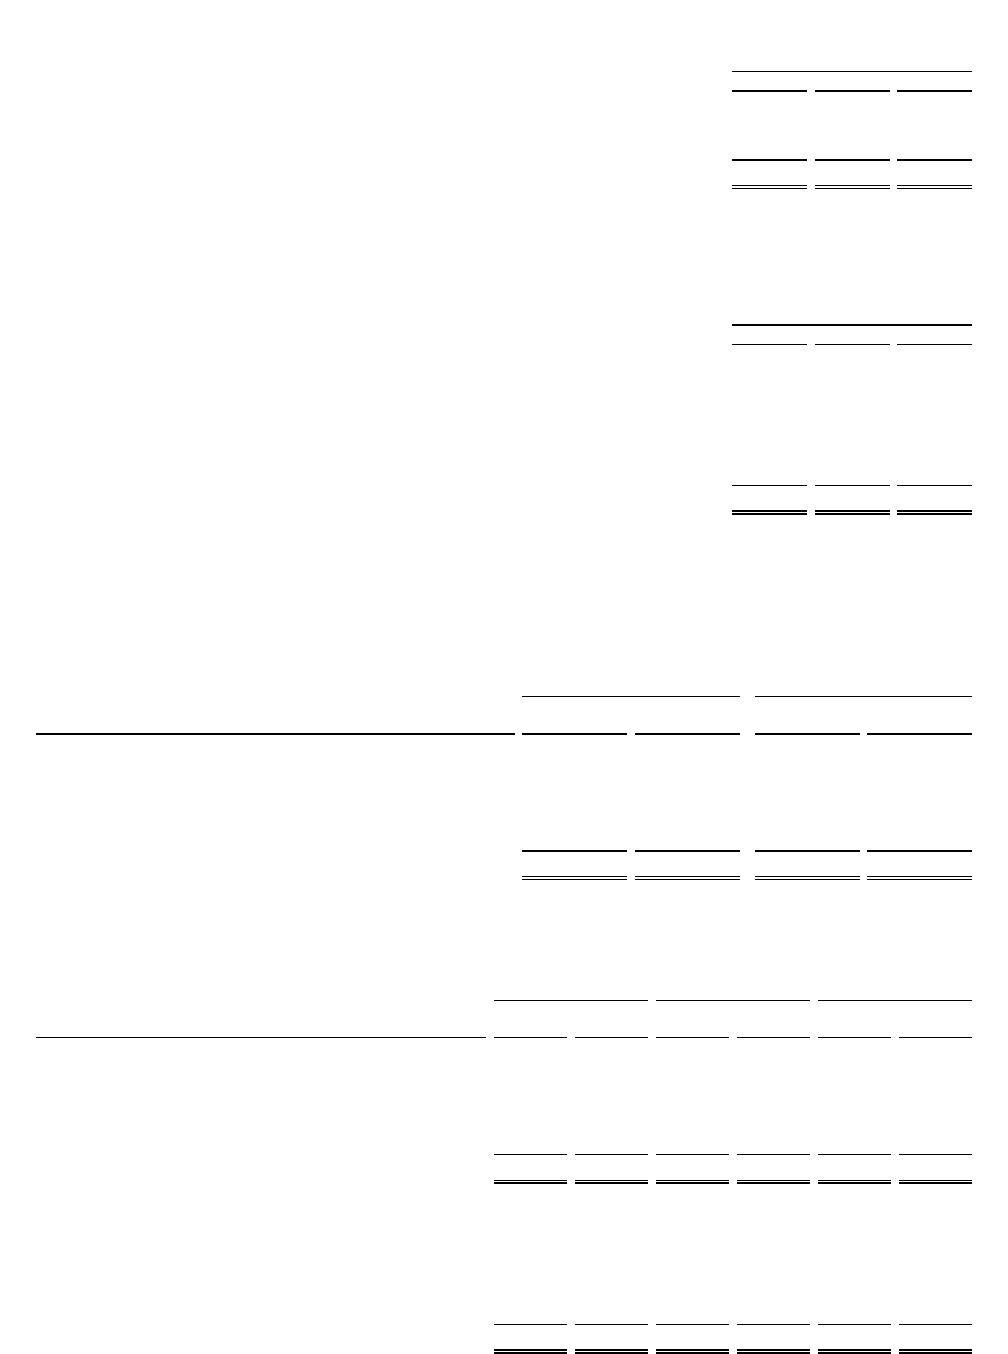
The gross realized gains and losses recognized in income are reflected in the following table:
Years Ended December 31,
2012 2011 2010
(Dollars in millions)
Gross gains $ 1 $ 175 $ 607
Gross losses (4) (1) (22)
N
et realized gains (losses) $ (3) $ 174 $ 585
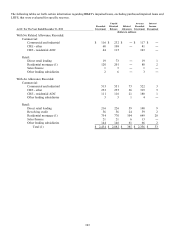
The following table reflects changes in credit losses on other-than-temporarily impaired securities, which was primarily non-
agency RMBS, where a portion of the unrealized loss was recognized in OCI. OTTI of $4 million related to covered
securities during 2012 is not reflected in this table.
Years Ended December 31,
2012 2011 2010
(Dollars in millions)
Balance at beginning of period $ 130 $ 31 $ 2
Credit losses on securities not previously considered other-than-temporarily
impaired ― 1 4
Credit losses on securities for which OTTI was previously recognized 5 111 28
Reductions for securities sold/settled during the period (30) (13) (3)
Balance at end of period $ 105 $ 130 $ 31
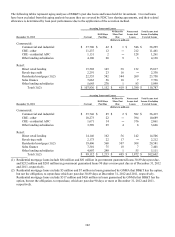
The amortized cost and estimated fair value of the debt securities portfolio at December 31, 2012, by contractual maturity,
are shown in the accompanying table. The expected life of RMBS will differ from contractual maturities because borrowers
may have the right to prepay the underlying mortgage loans with or without prepayment penalties. For purposes of the
maturity table, RMBS, which are not due at a single maturity date, have been included in maturity groupings based on the
contractual maturity.
Available for Sale Held to Maturity
Amortized Fair Amortized Fair
December 31, 2012 Cost Value Cost Value
(Dollars in millions)
Due in one year or less $ 190 $ 190 $ ― $ ―
Due after one year through five years 130 133 ― ―
Due after five years through ten years 636 676 3,674 3,688
Due after ten years 23,221 24,138 9,920 10,160
Total debt securities $ 24,177 $ 25,137 $ 13,594 $ 13,848
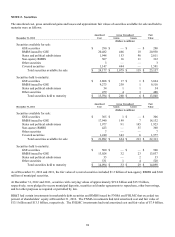
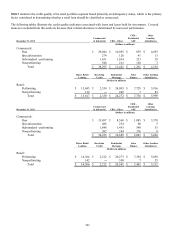
The following tables reflect the gross unrealized losses and fair values of BB&T’ s investments, aggregated by investment
category and length of time that individual securities have been in a continuous unrealized loss position:
Less than 12 months 12 months or more Total
Fair Unrealized Fair Unrealized Fair Unrealized
December 31, 2012 Value Losses Value Losses Value Losses
(Dollars in millions)
Securities available for sale:
RMBS issued by GSE $ 2,662 $ 18 $ — $ — $ 2,662 $ 18
States and political subdivisions 52 1 478 89 530 90
N
on-agency RMBS — — 113 11 113 11
Total $ 2,714 $ 19 $ 591 $ 100 $ 3,305 $ 119
Securities held to maturity:
GSE securities $ 805 $ 1 $ — $ — $ 805 $ 1
RMBS issued by GSE 593 1 — — 593 1
States and political subdivisions 22 1 — — 22 1
Other securities 266 3 — — 266 3
Total $ 1,686 $ 6 $ — $ — $ 1,686 $ 6